
|
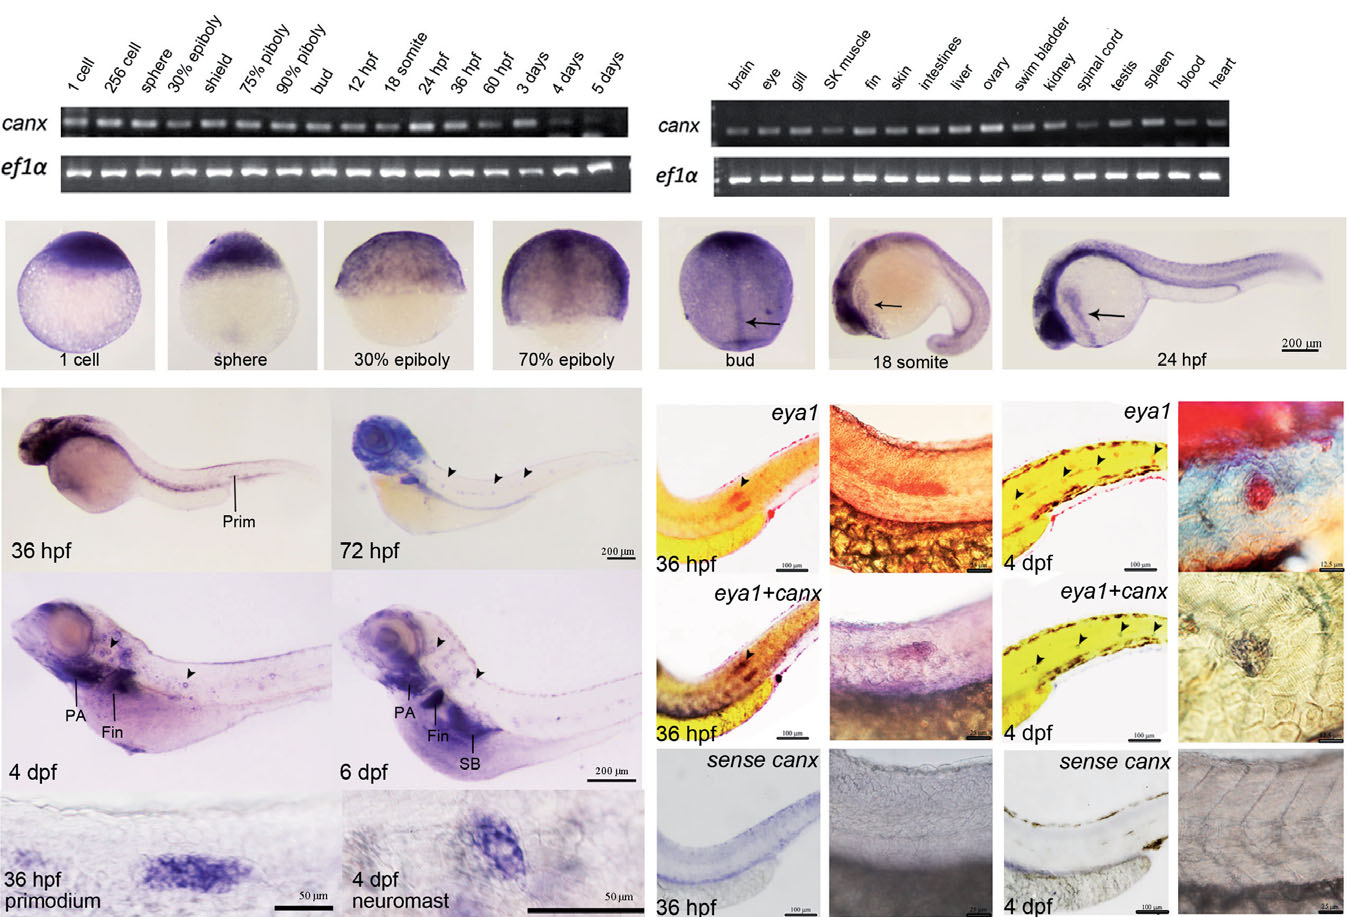
Fig. 2
Spatial and temporal expression patterns of calnexin in developing zebrafish embryos. RT-PCR analyses of calnexin were performed using cDNAs from embryos at designated stages (A) and in different adult tissues (B). A 107-bp calnexin fragment was amplified, and a 524-bp ef1α fragment was also amplified as an internal control. (C-U′) Whole-mount in situ hybridization by a calnexin antisense riboprobe was performed in embryos at designated stages. All photographs shown are in lateral view except for F and G which are in dorsal view; (H-U′) anterior to the left, dorsal to the top. Arrows indicate the notochord (G) and hatching gland (H, I). Arrowheads point to selected neuromasts (K-M); Large scale view of primordium (N) and neuromast (O). (P-S) Co-expression assay eya1 and canx. Embryos were fixed at designated times and subjected to WISH against indicated genes. Arrows point to primordia in panels P and R and neuromasts in panels Q and S, respectively. Enlarged images are shown in panels P′-S′. hpf, hours post-fertilization; dpf, days post-fertilization; Prim, primordium; PA, pharyngeal arch; SB, swim bladder.