
|
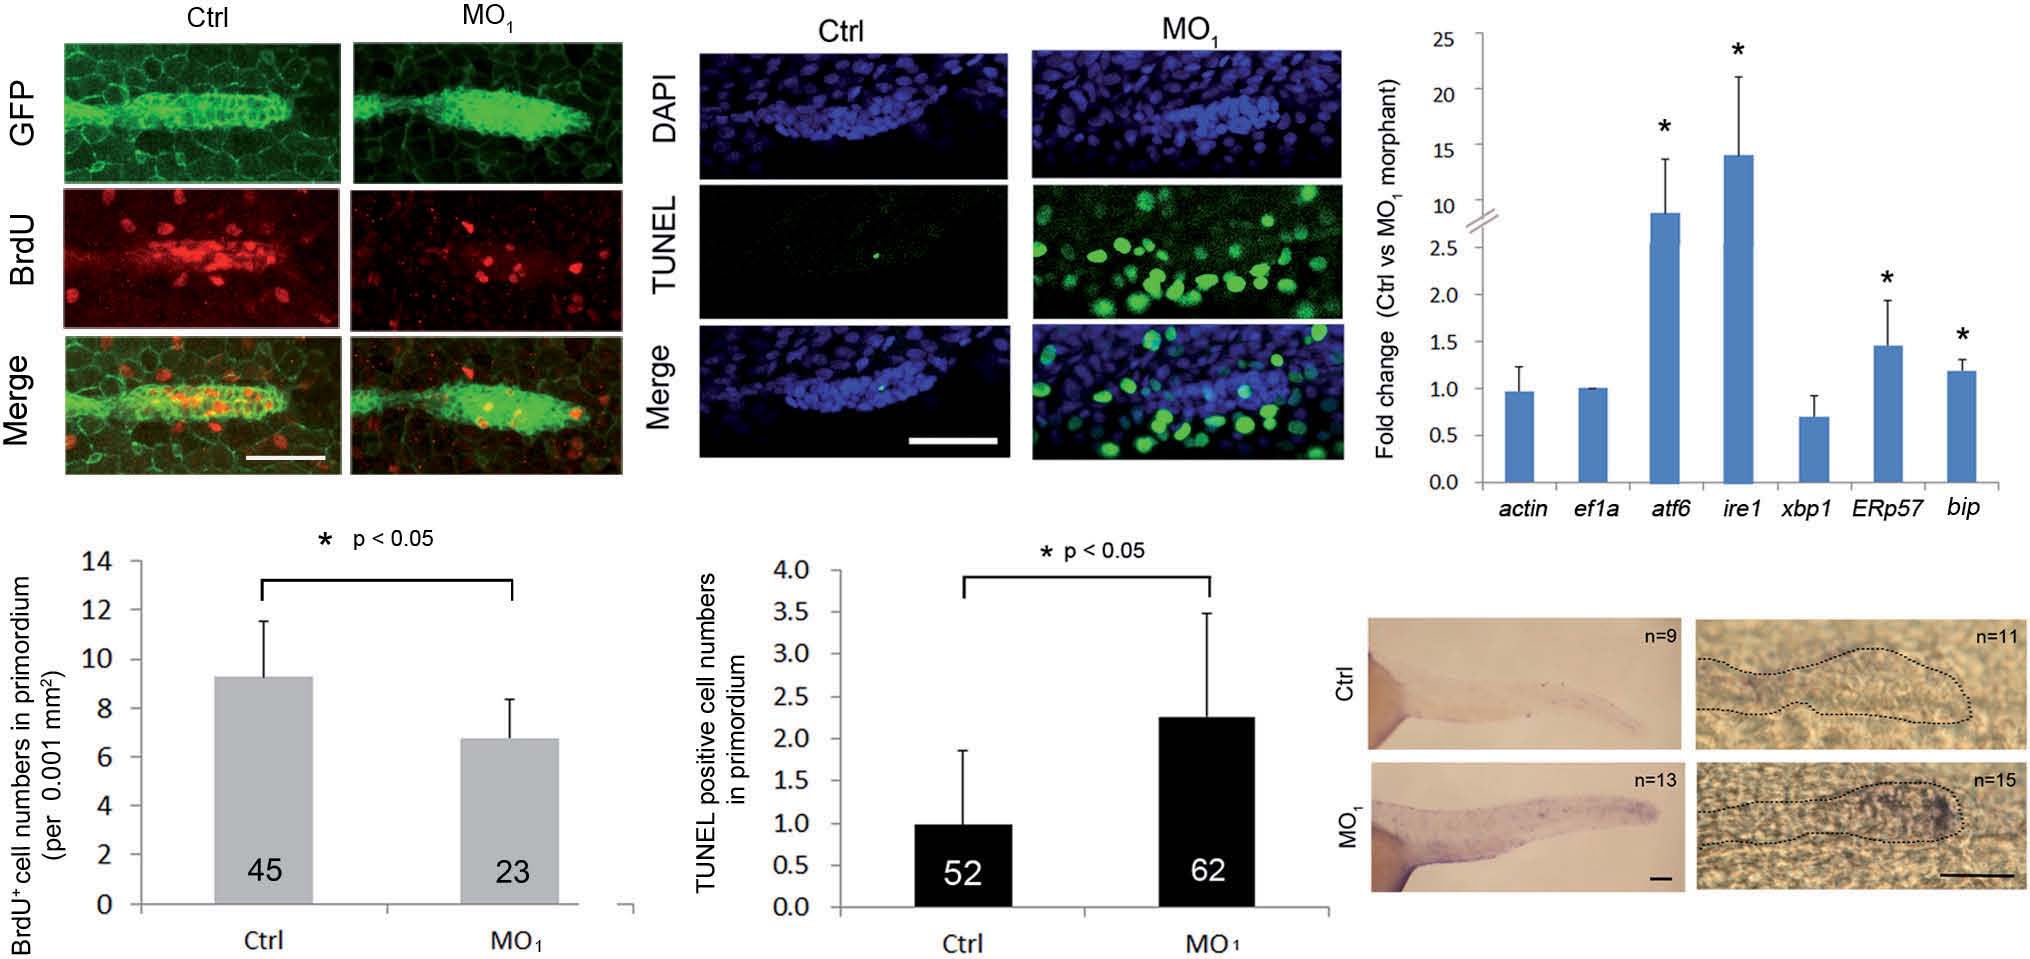
Fig. 9
Loss of calnexin inhibited cell proliferation and enhanced apoptosis in the posterior lateral line primordium (PLLP). (A) Transgenic claudin b:gfp embryos were treated without and with 3.75 ng of the calnexin MO1 and collected at 32 hpf. Embryos were labeled with BrdU to reveal proliferating cell and the PLLP was shown by immunostaining against GFP (green). Embryos were examined under confocal microscopy. Photographs are shown in each channel and superimposed images are shown at the bottom. (B) The proliferation rate was estimated by the average number of BrdU-positive cells per 0.001 mm2 of PLLP. (C) Nuclei of treated embryos were stained with DAPI in blue and apoptotic cells were revealed by a TUNEL staining in green. The average numbers of apoptotic cells in the PLLP are shown in (D). (E) Embryos were treated as above and subjected to real-time PCR analysis against designated endoplasmic reticular stress-related genes at 36 hpf. (F) WISH against bip was performed and photographed to show the posterior (left) and PLLP (right) regions. Black dotted lines outline the PLLP region. * The value significantly differs from that of control embryos (p < 0.05). Photographs are shown with the anterior to the left. Scale bar: 50 µm.