
|
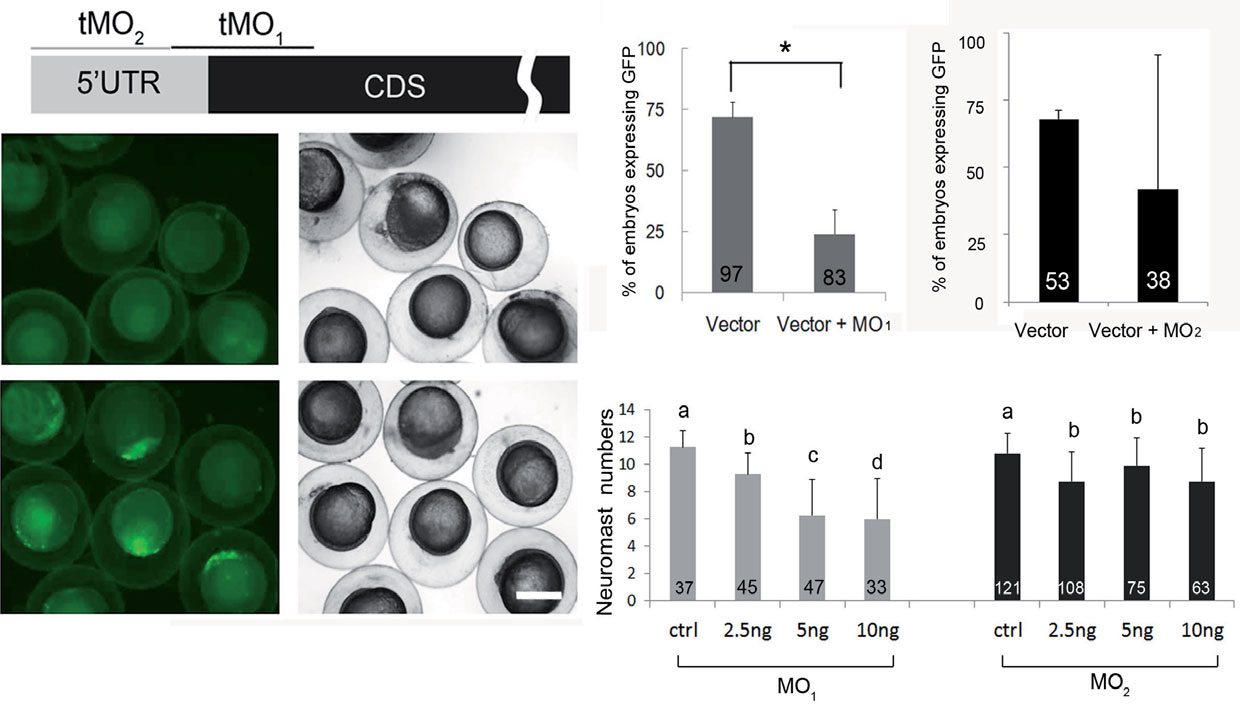
Fig. 5
Knockdown of calreticulin causes a reduction in posterior lateral line neuromasts. (A) A partial mRNA map of calreticulin is presented with indicated MO binding sites. The potency of MO1 to reduce calreticulin expression was shown by co-injecting 150 pg of the pCS2+-CRT-GFP-XLT plasmid with (B,C) or without (D,E) calreticulin MO1; then it was cultured, observed under a bright (C,E) or dark field (B,D), and photographed at 10 hpf. The percentage (%) of green fluorescent protein (GFP)-expressing embryos for 5ng calreticulin MO1 or calreticulin MO2 for each treatment is shown as the mean ± standard error in (F,G), respectively. Embryos were treated, observed and shown as described previously. Numbers of neuromasts on the left side of the trunk in all treatments were counted and are shown in (H). Different letters at the top of each column indicate a significant difference between groups at p < 0.05. Scale bar: 200 µm. The number within each column is the sample size.