
|
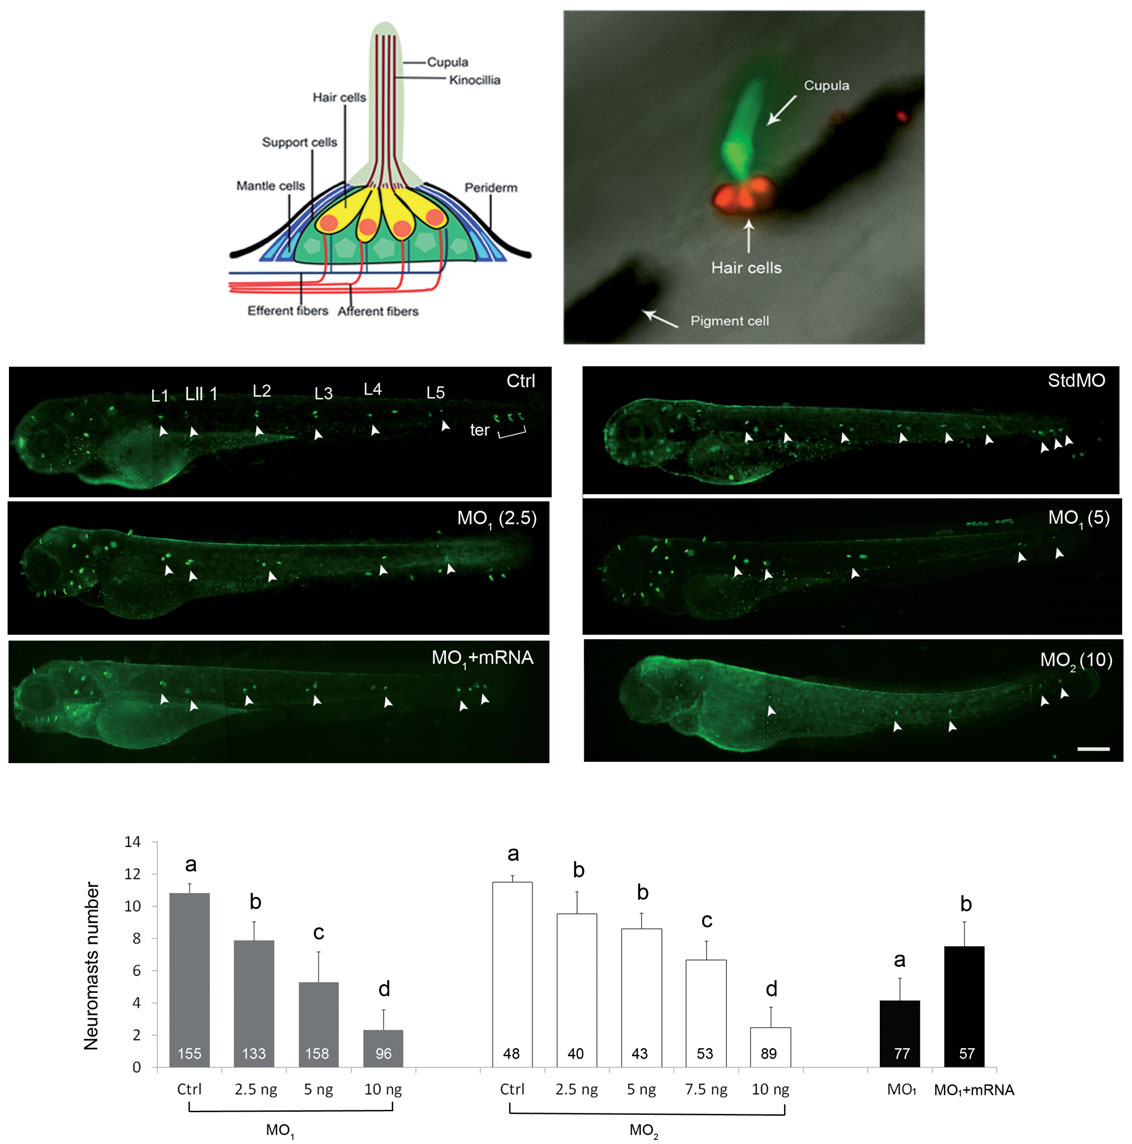
Fig. 4
Knockdown of calnexin dose-dependently inhibited the formation of neuromasts. (A) Diagram of a fish neuromast (modified from (Ma and Raible, 2009). (B) A zebrafish neuromast was labeled by WGA 488 (green) and DASPEI (red) to respectively reveal its cupula and hair cells. Two large black patches are pigments. (C-I) Embryos were treated without or with indicated morpholino oligonucleotide (MO; ng/embryo) of a standard control MO (stdMO, 5 ng), calnexin MO1 or calnexin MO2, incubated until 3 days post-fertilization, stained with WGA 488, and observed and photographed under epifluorescence microscopy. calnexin mRNAs (25 pg) was added for MO rescue (G). Photographs are shown in lateral view with the anterior toward the left and posterior to the right. Only left side trunk neuromasts are indicated by white arrowheads. Trunk neuromasts are designated L1~ L5, Lll1, and ter as shown in untreated larvae (C, Ctrl). The vague green fluorescent spots are out-of-focus neuromasts on the opposite side of the trunk. Numbers of left side neuromasts were counted (I). Different letters at the top of each column indicate a significant difference between groups at p < 0.05. Scale bar: 200 am. The number within each column is the sample size.