
|
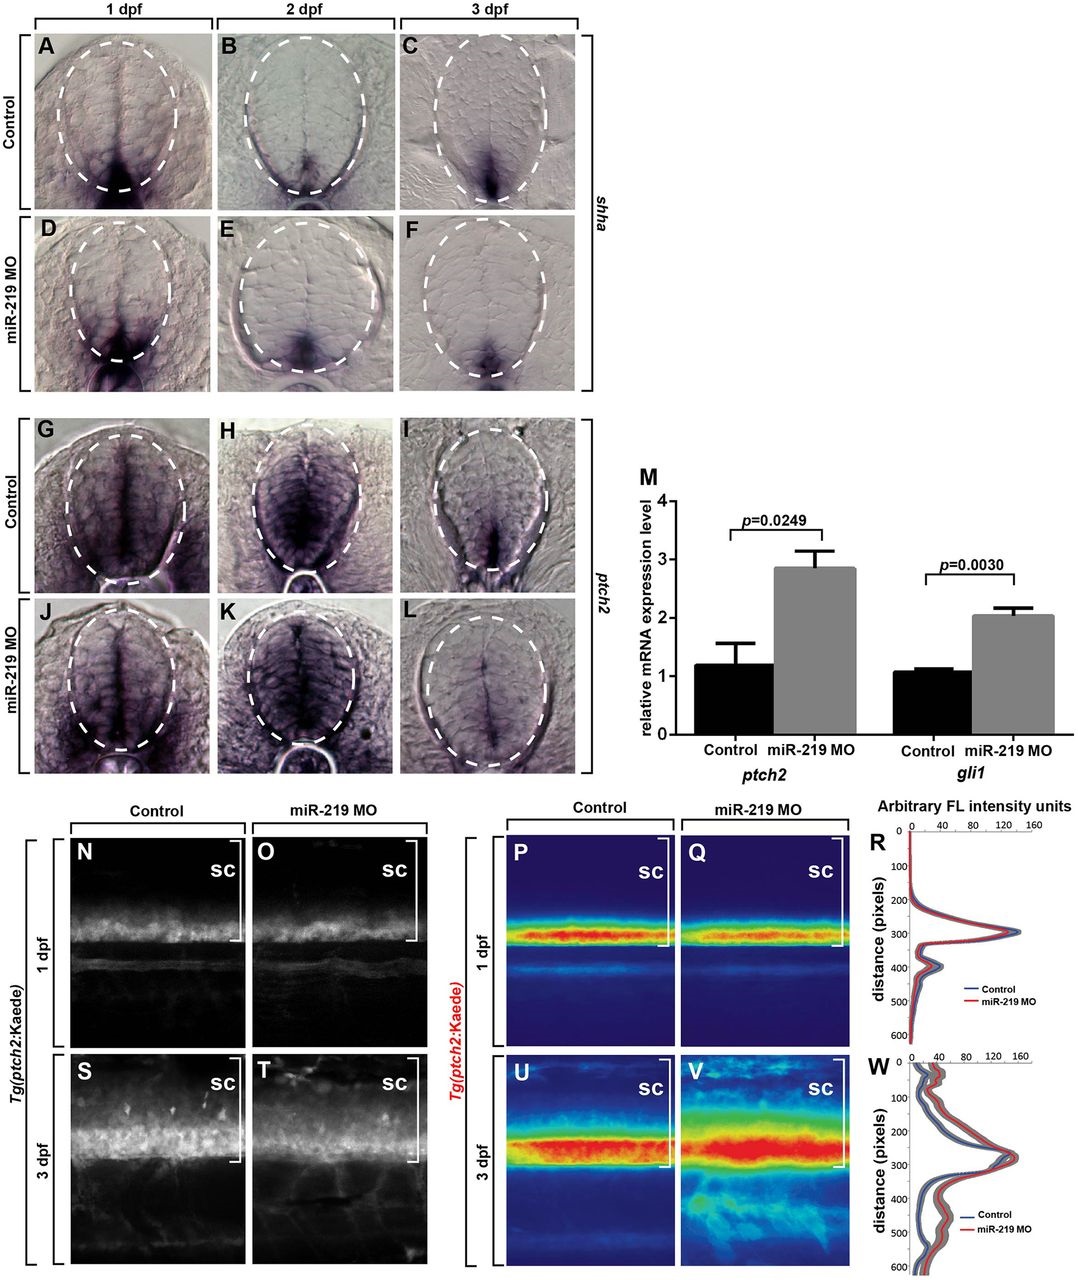
Fig. 1
Reduction of miR-219 causes persistent Hh signaling. (A-L) Representative transverse sections through trunk spinal cord with dorsal up. Dashed circles outline spinal cords. In situ RNA hybridization to detect shha in wild-type embryos (A-C) and miR-219 MO-injected embryos (D-F) at 1, 2 and 3dpf (G-I). In situ RNA hybridization to detect ptch2 transcripts in wild-type embryos reveals expression throughout the entire dorsoventral axis of the spinal cord at 1 and 2dpf. By 3dpf, expression is confined to an area bordering the ventrally located central canal. (J-L) miR-219 MO-injected embryos processed to detect ptch2 RNA. ptch2 expression appears to persist in dorsal spinal cord of the miR-219-deficient embryo (L). (M) Graph showing that 3dpf miR-219 MO-injected larvae express ptch2 and gli1 RNA at higher levels than stage-matched controls. Data represent the mean±s.e.m. (n=3 biological replicate experiments, consisting of 15-20 larvae, each). Significance calculated using an unpaired t-test. (N-Q) Representative maximum projection images of confocal images stacks of ptch2:Kaede expression in control and miR-219 MO-injected embryos at 1dpf (N,O) and 3dpf (P,Q). (R-U) Heat maps showing the average normalized fluorescence profile of spinal cord (sc, brackets) ptch2:Kaede at 1dpf (n=22 control embryos and 20 miR-219 MO-injected embryos) (R,S) and 3dpf (n=22 control and 18 miR-219 MO-injected) (T,U), straightened and aligned along the dorsoventral axis, with dorsal to the top. All heat maps display in the range of 0-150 arbitrary fluorescence intensity units (blue to red). (V,W) Average normalized fluorescence profile of ptch2:Kaede fluorescence generated by creating line scans along the dorsoventral axis. The solid colored lines (red and blue) represent the average normalized fluorescence profile at each pixel along the dorsoventral axis of 1dpf (R) and 3dpf (W) spinal cords, whereas the grey lines represent the s.e.m. at each pixel.