
|
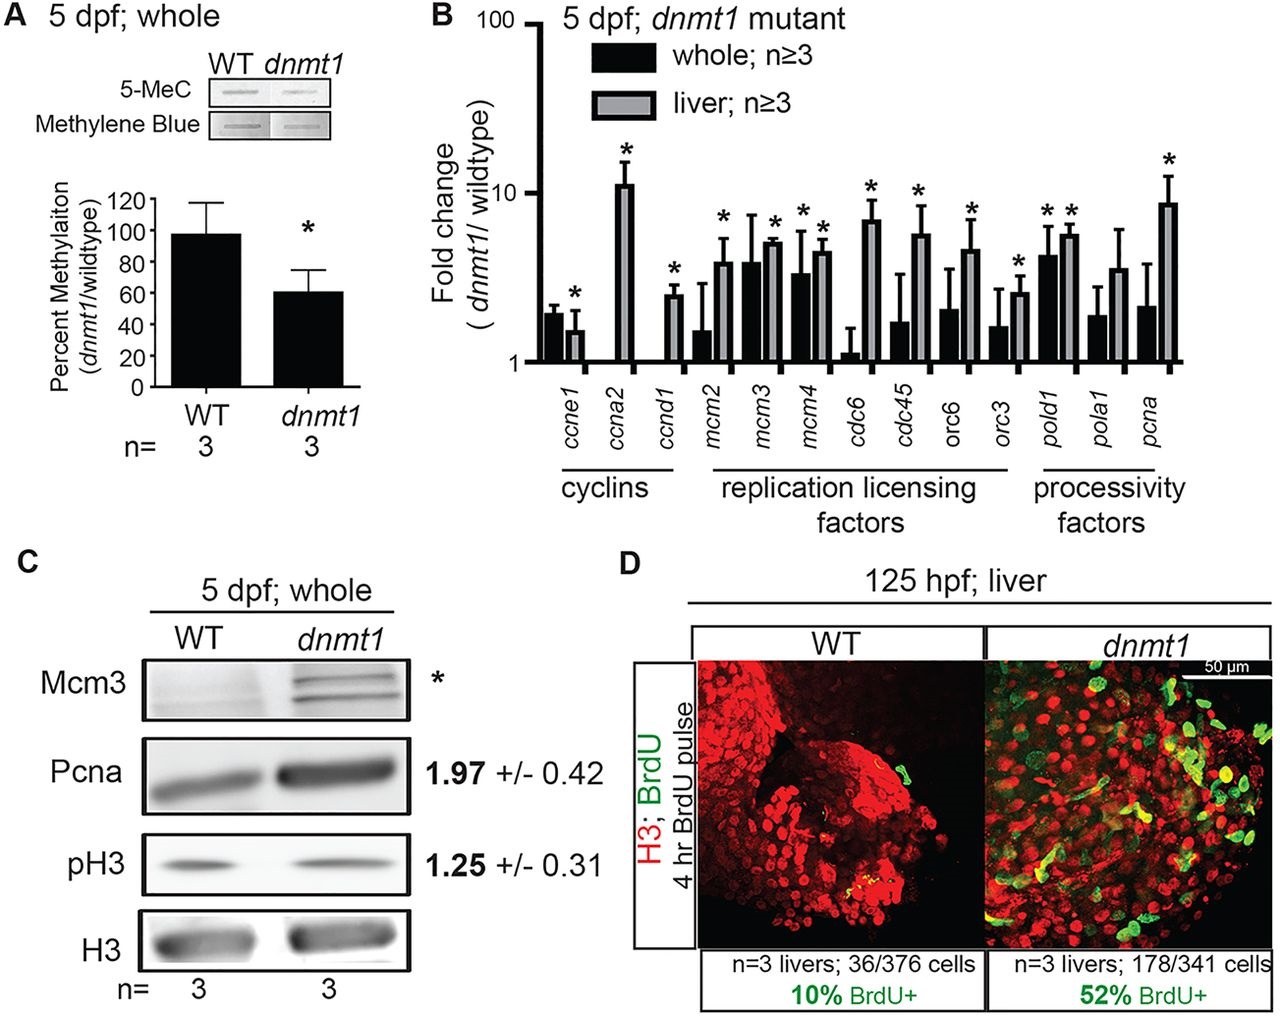
Fig. 7
The cell cycle phenotype in uhrf1 mutants is phenocopied by dnmt1 mutation. (A) Average levels of 5-MeC in 5dpf whole dnmt1 embryos and wild-type siblings was measured by slot blot in pools of embryos from three clutches. (B) qPCR of cell cycle genes from 5dpf whole larvae (black) and dissected livers (gray) from three to five clutches of dnmt1 mutants and wild-type siblings. Student′s t-test on ΔΔCt values was used to determine significance; *P<0.05. (C) Western blot of Mcm3, pH3 and PCNA in 5dpf whole dnmt1 wild-type and mutant fish with the average fold change of the ratio to H3 indicated for three samples ±s.d. There was no Mcm3 detected in wild-type larvae, precluding calculation of the fold change. (D) Representative image of BrdU and H3 immunoflourescence on a liver from dnmt1 and wild-type larvae exposed to BrdU from 120 to 125hpf. The average ratio of BrdU/H3-positive nuclei is indicated.