
|
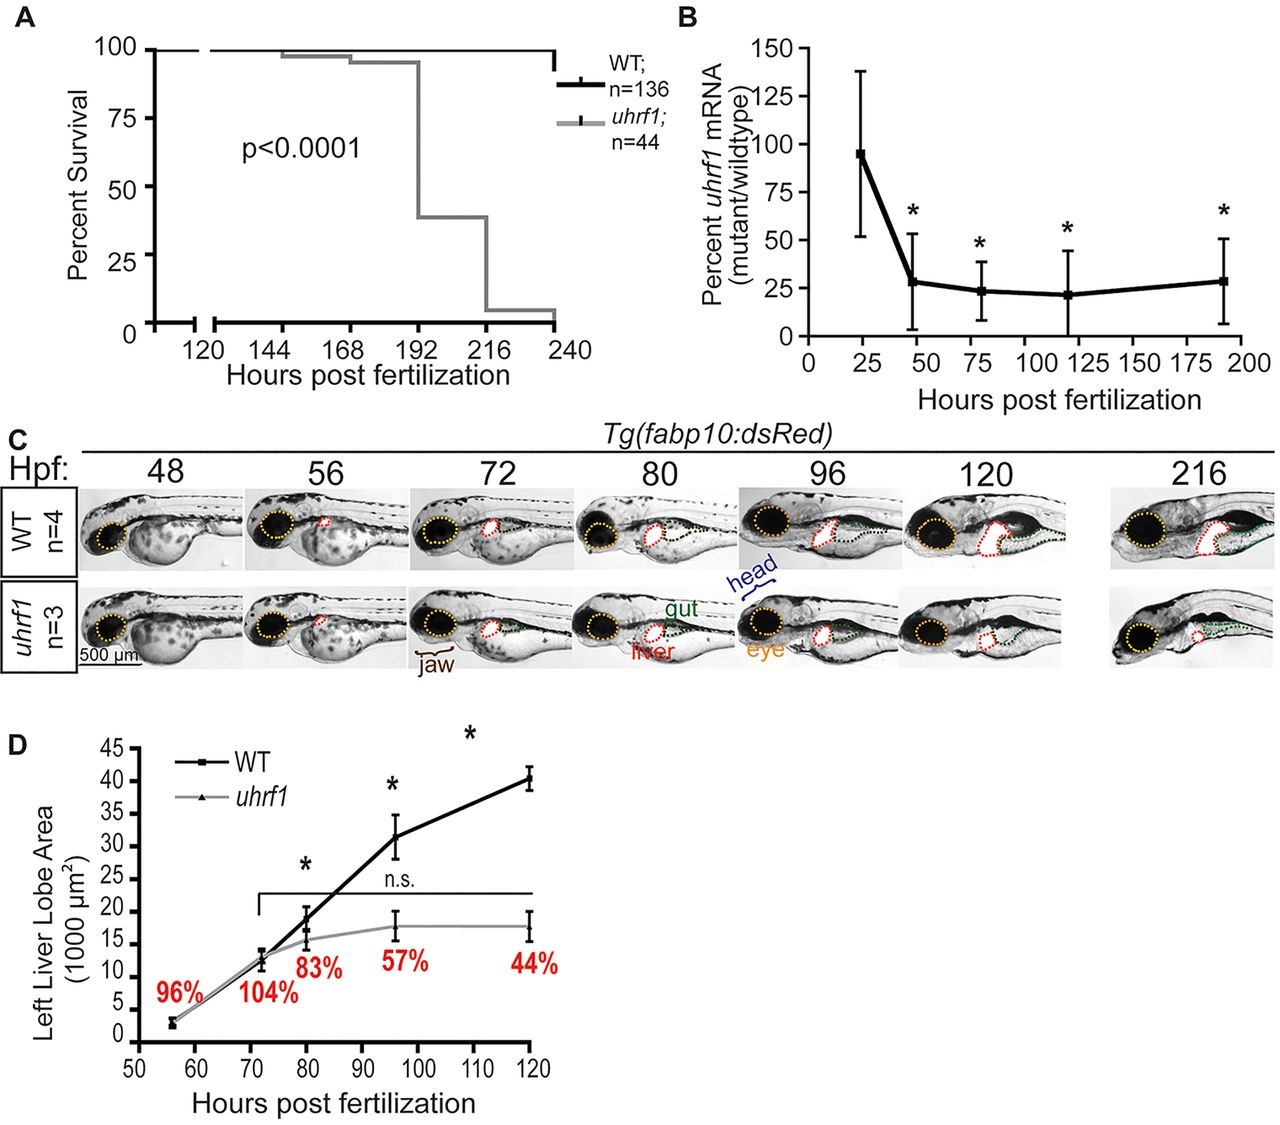
Fig. 1
Reduction in uhrf1 mRNA expression precedes onset of mutant phenotype. (A) Cumulative survival of uhrf1 mutant larva and wild-type siblings. (B) uhrf1 mRNA levels were measured by qPCR over a period of 25-200 hours post fertilization (hpf). Embryos were individually genotyped prior to 72h to identify mutants and older larvae were sorted based on morphological phenotype. Data are average fold change in expression from three or more clutches. *P<0.05 by Student′s t-test. (C) The same wild-type and uhrf1 mutant embryo was imaged every day, except at 216hpf, when larvae from a separate clutch were used. Labels on the head, jaw, eye, liver (highlighted using the fabp10:dsRed transgene) and gut indicate the first time point at which defects in these tissues become visible in uhrf1 mutants. (D) Left liver lobe area was measured in four wild-type and three mutant larvae at 56-120hpf. The relative size of the uhrf1 mutant liver relative to wild-type siblings is labeled in red. *P<0.05 by Student′s t-test, error bars are s.d.