
|
Fig. S1
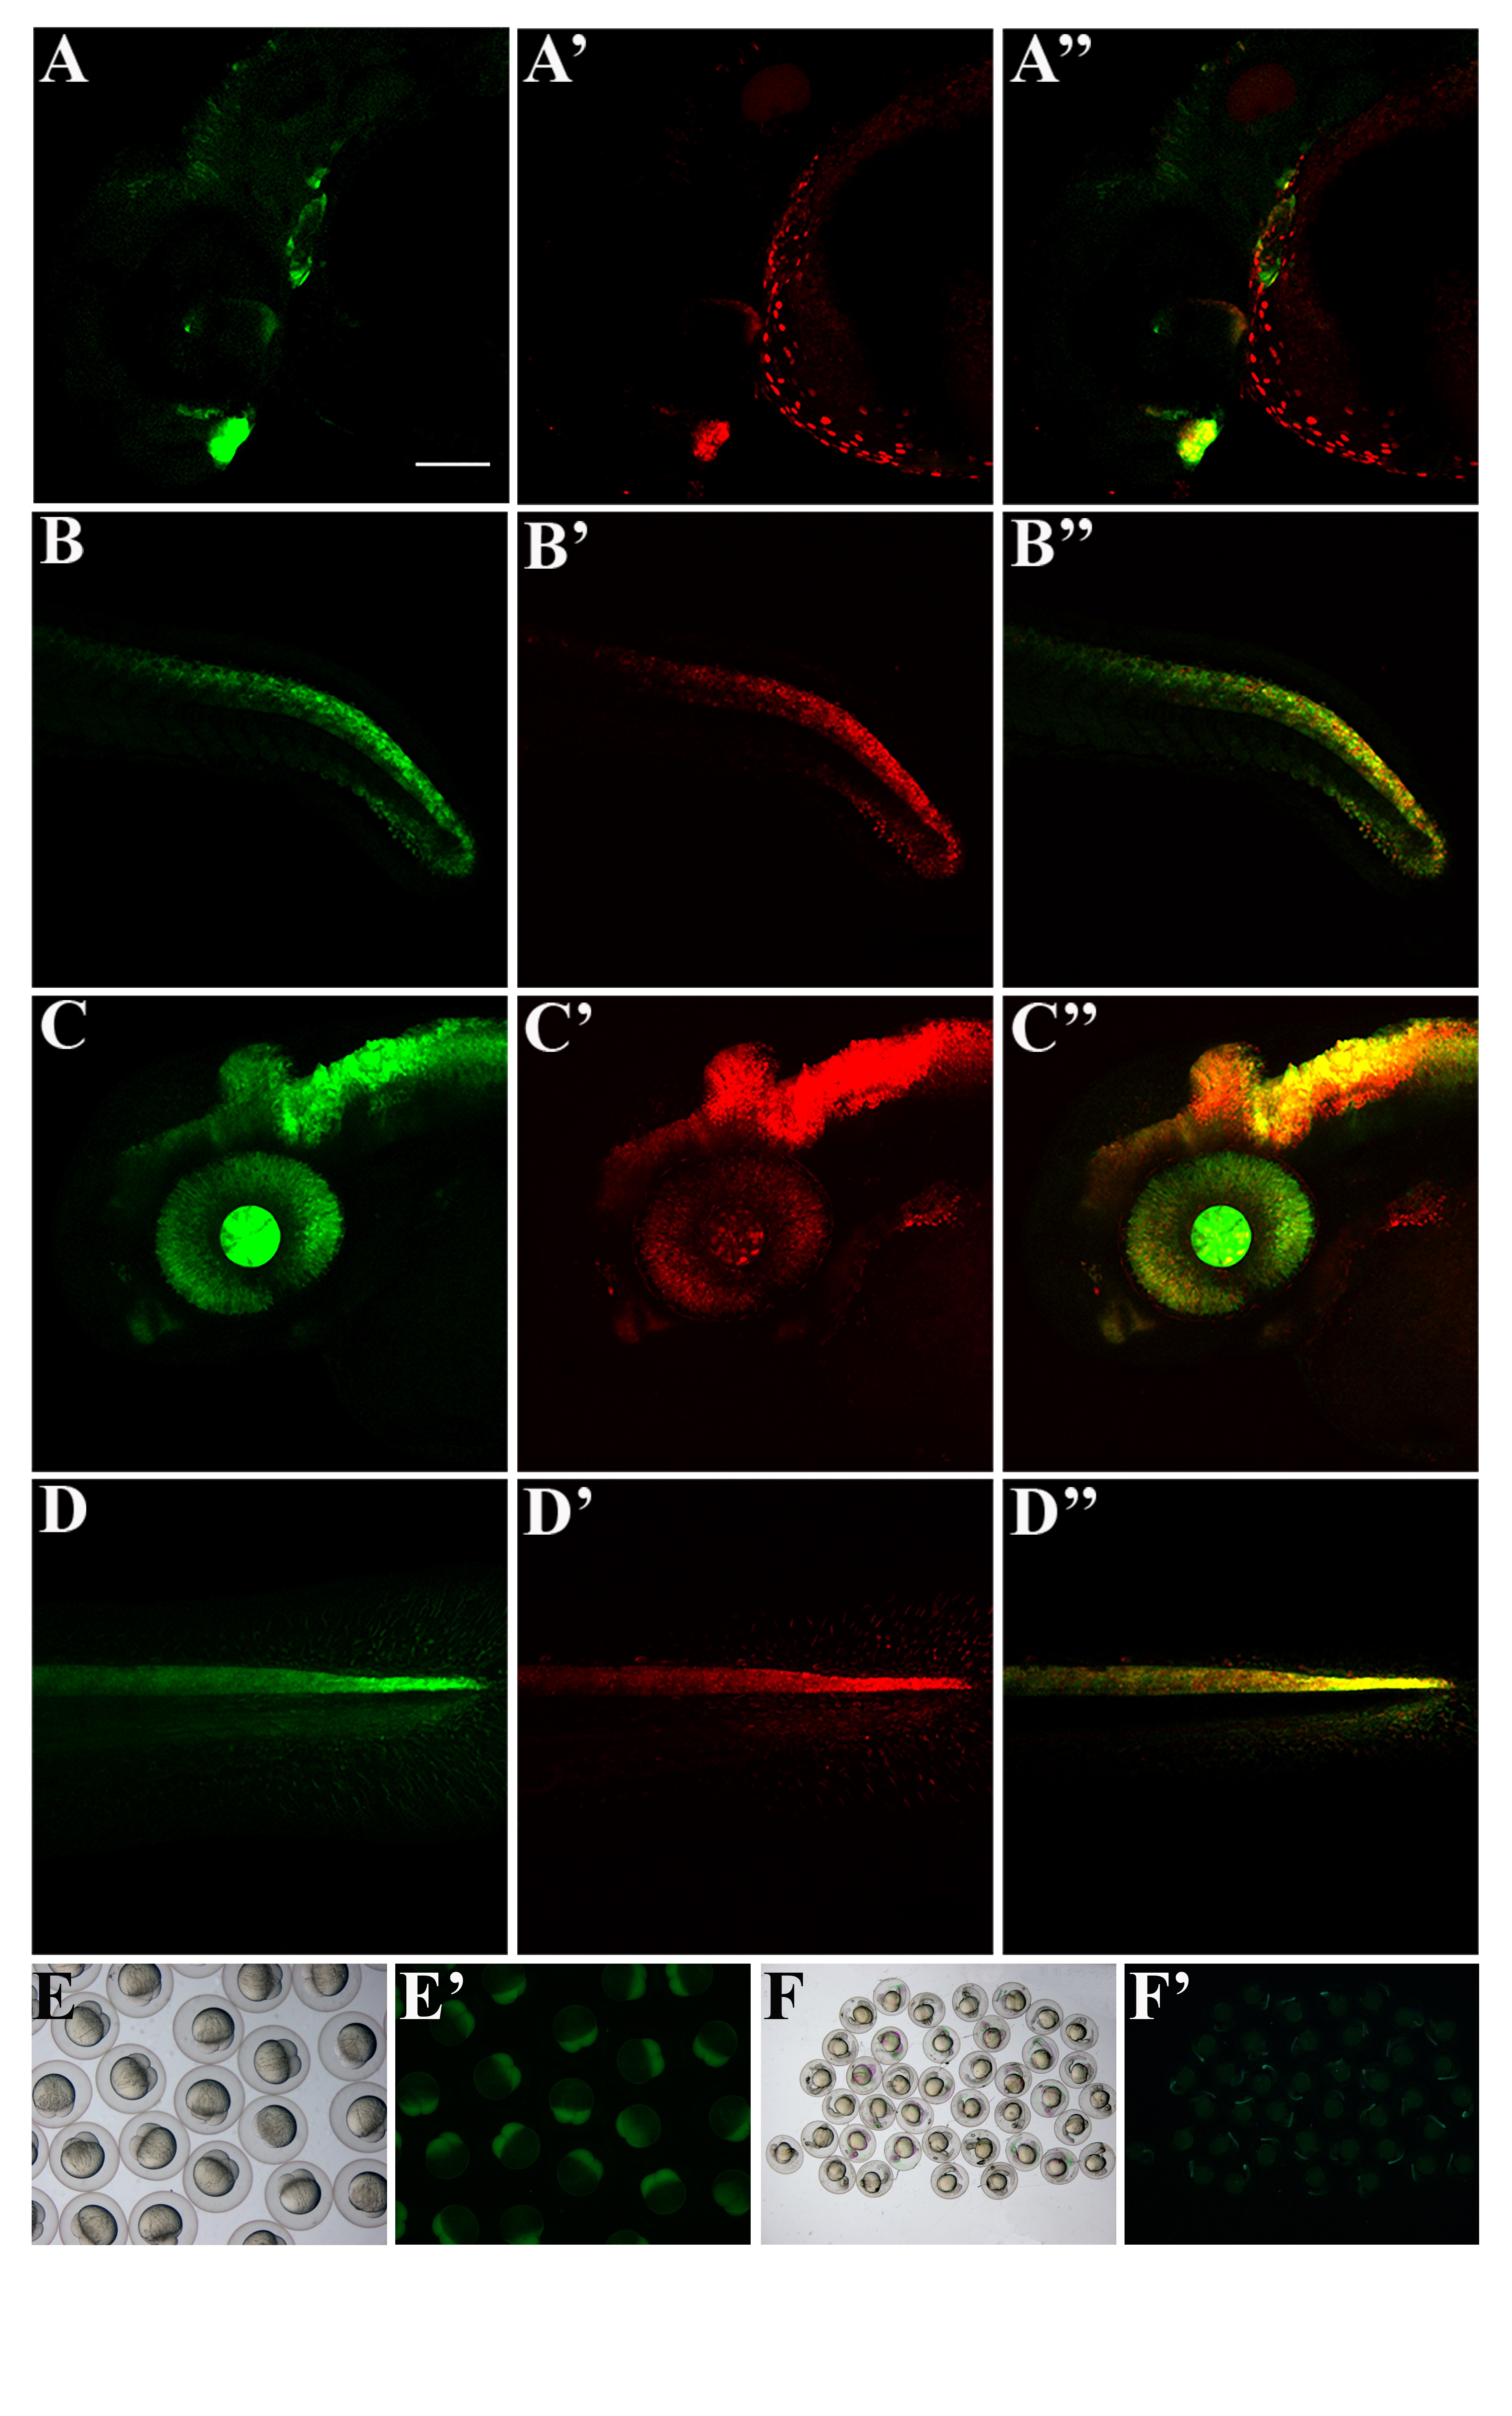
12xSBE lines have similar expression patterns. Confocal lateral views of double transgenic Tg(12xSBE:EGFP)ia16/Tg(12xSBE:nls-mCherry)ia15 24 hpf embryos and 48 hpf larvae, anterior to the left, Z-stack images. A-A′′, head region of a 24 hpf double transgenic embryo: A, green channel; A′, red channel; A′′, merge; B-B′′, tail region of a 24 hpf double transgenic embryo: B, green channel; B′, red channel; B′′, merge; C-C′′, head region of a 48 hpf double transgenic larva: C, green channel; C′, red channel; C′′, merge; D-D′′, tail region of a 24 hpf double transgenic embryo: D, green channel; D′, red channel; D′′, merge. Scale bar is 100 µm. E-E′, brightfield and fluorescent image of GFP+ 2 cell stage embryos from a Tg(12xSBE:EGFP)ia16 female carrier. F-F′ , brightfield and fluorescent image of GFP+ embryos from an outcross of a Tg(12xSBE:EGFP)ia16 male carrier.
Reprinted from Developmental Biology, 396(1), Casari, A., Schiavone, M., Facchinello, N., Vettori, A., Meyer, D., Tiso, N., Moro, E., Argenton, F., A Smad3 transgenic reporter reveals TGF-beta control of zebrafish spinal cord development, 81-93, Copyright (2014) with permission from Elsevier. Full text @ Dev. Biol.