
|
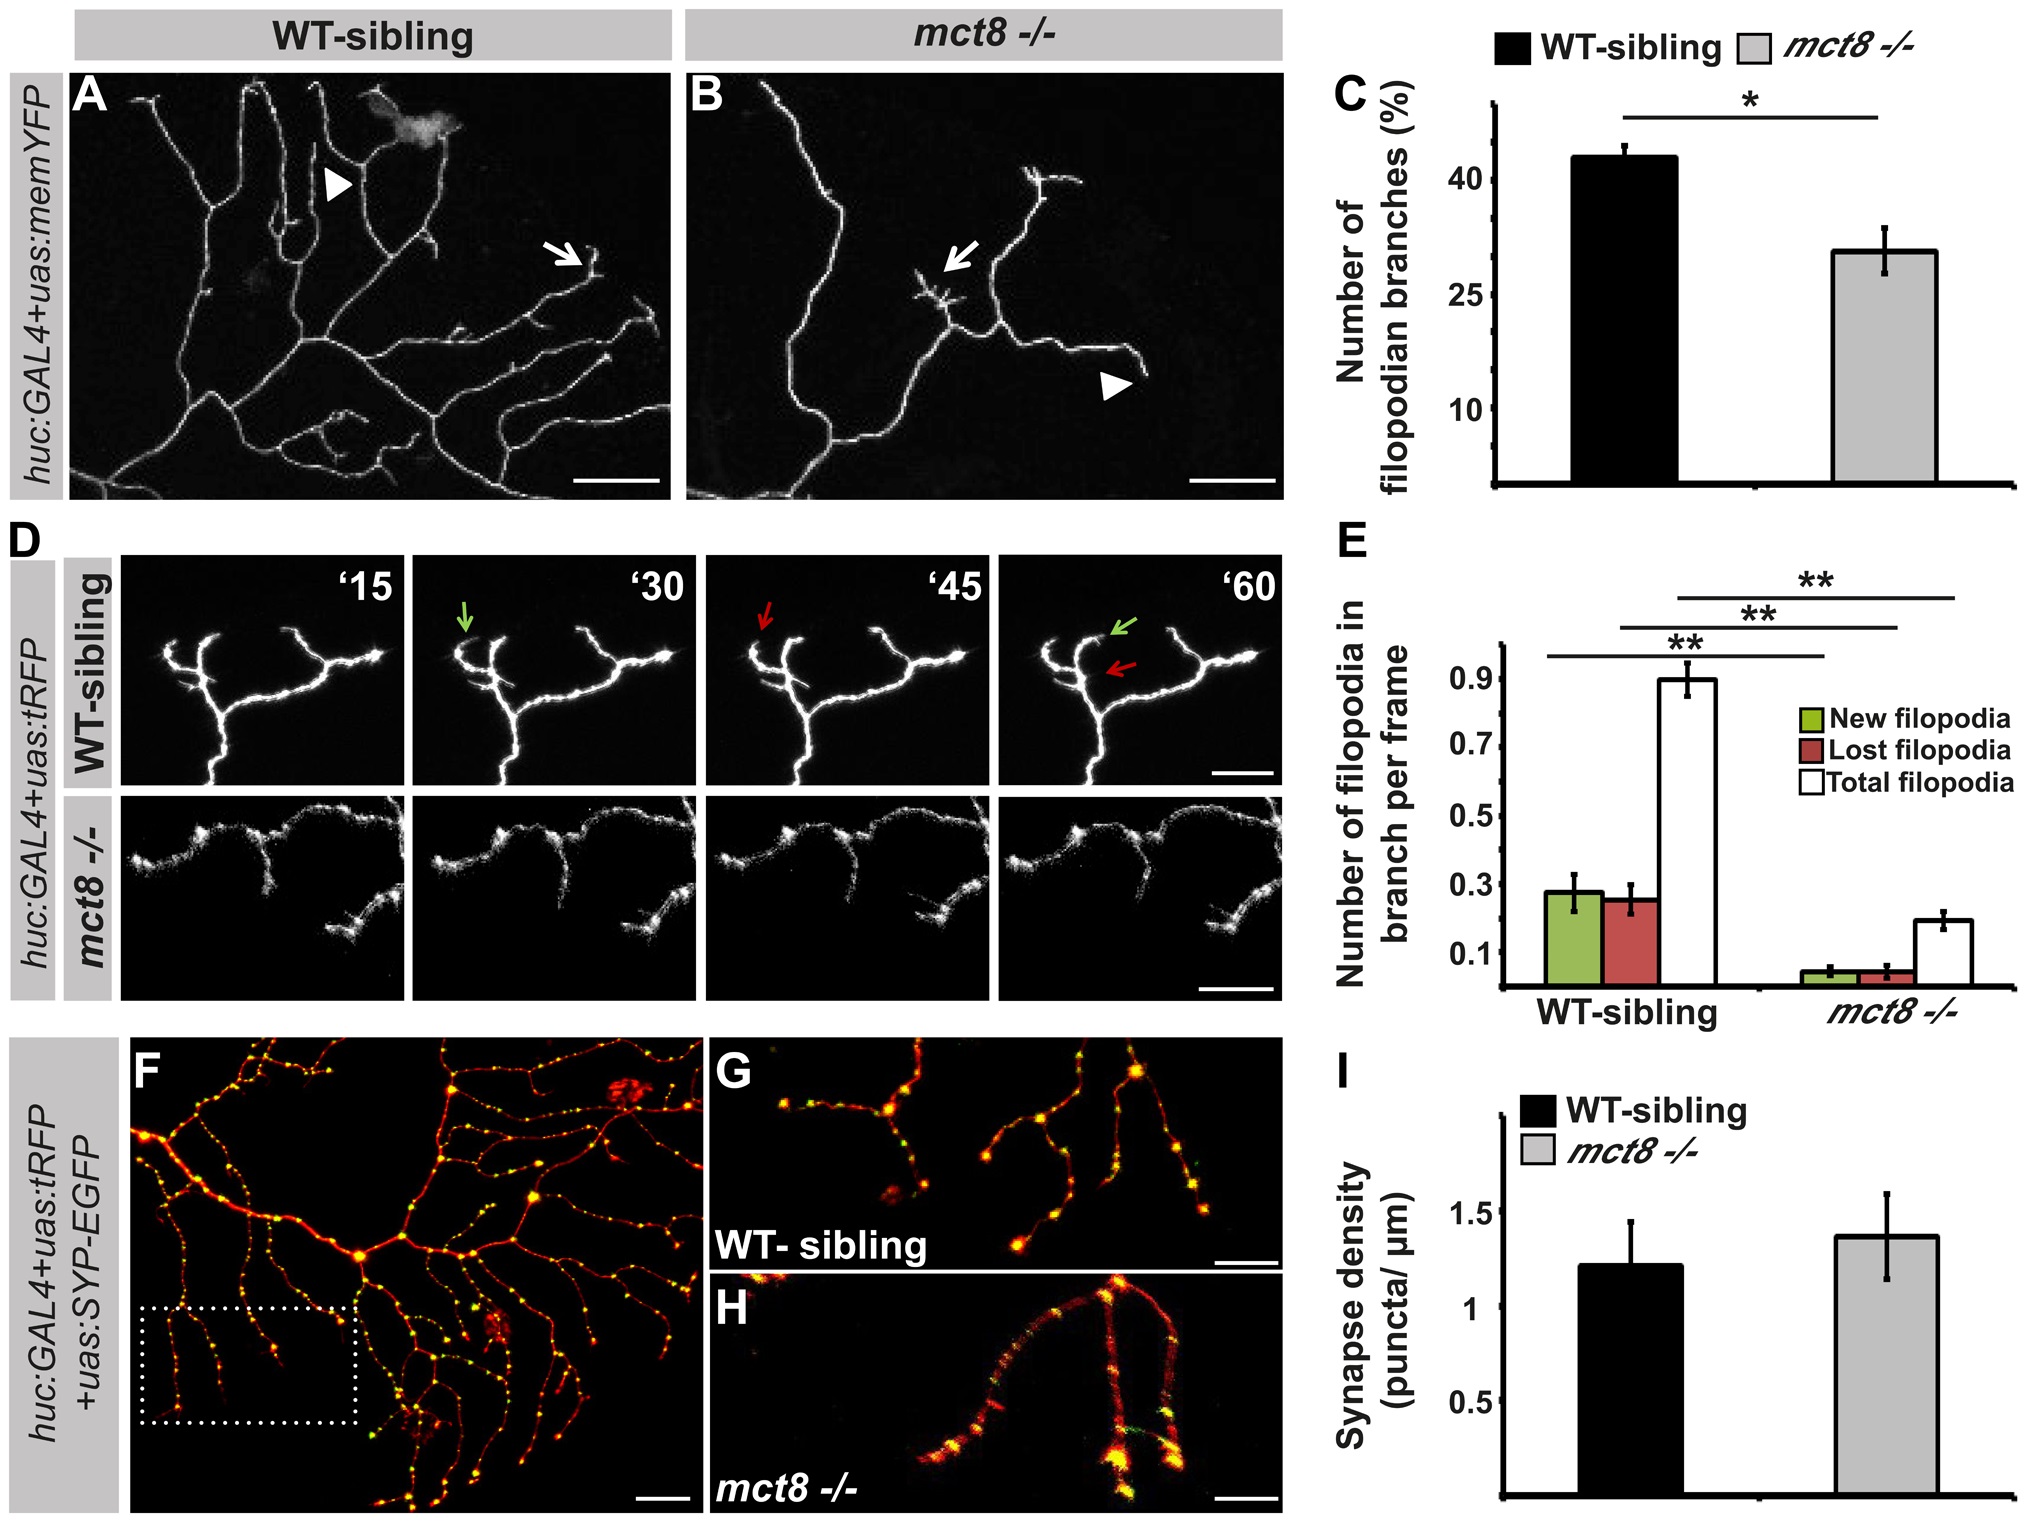
Fig. 8
MCT8 reduces filopodia dynamics in the axons of RB neurons. A-B. High magnification views of the dotted area shown in Fig. 7L and 7M, respectively. Arrows mark branches that contain filopodia and arrowheads mark branches that lack filopodia. C. Number of filopodian branches in mct8-/- and WT-sibling embryos. D. Time-lapse live imaging of axon arbor of RB sensory neuron (15 min intervals during 135 min). A representative series of images that were taken every 15 min in live mct8-/- and WT-sibling embryos is shown. Filopodia dynamics is defined as the number of new (green arrows) and lost (red arrows) filopodia per branch over time. E. Filopodia dynamics per branch during 150 min. F-H. Live imaging of synapses in the axons of the RB sensory neurons. F. Lateral view of axons and synapses marked with tRFP and SYP-EGFP, respectively. The dotted frame marks the area shown in high magnification in G and H. I. Synapse density in the RB-neuron arbor of mct8-/- and WT-sibling embryos measured along the last 50 µm of a single branch. Scale bar = 30 µm. Values represented as means ±SEM (standard error of the mean). Statistical significance determined by t-test: two-sample assuming unequal variances followed by one-sample Kolmogorov-Smirnov test to assume normal distribution (*p<0.05, ** p<0.001).