
|
Fig. 2
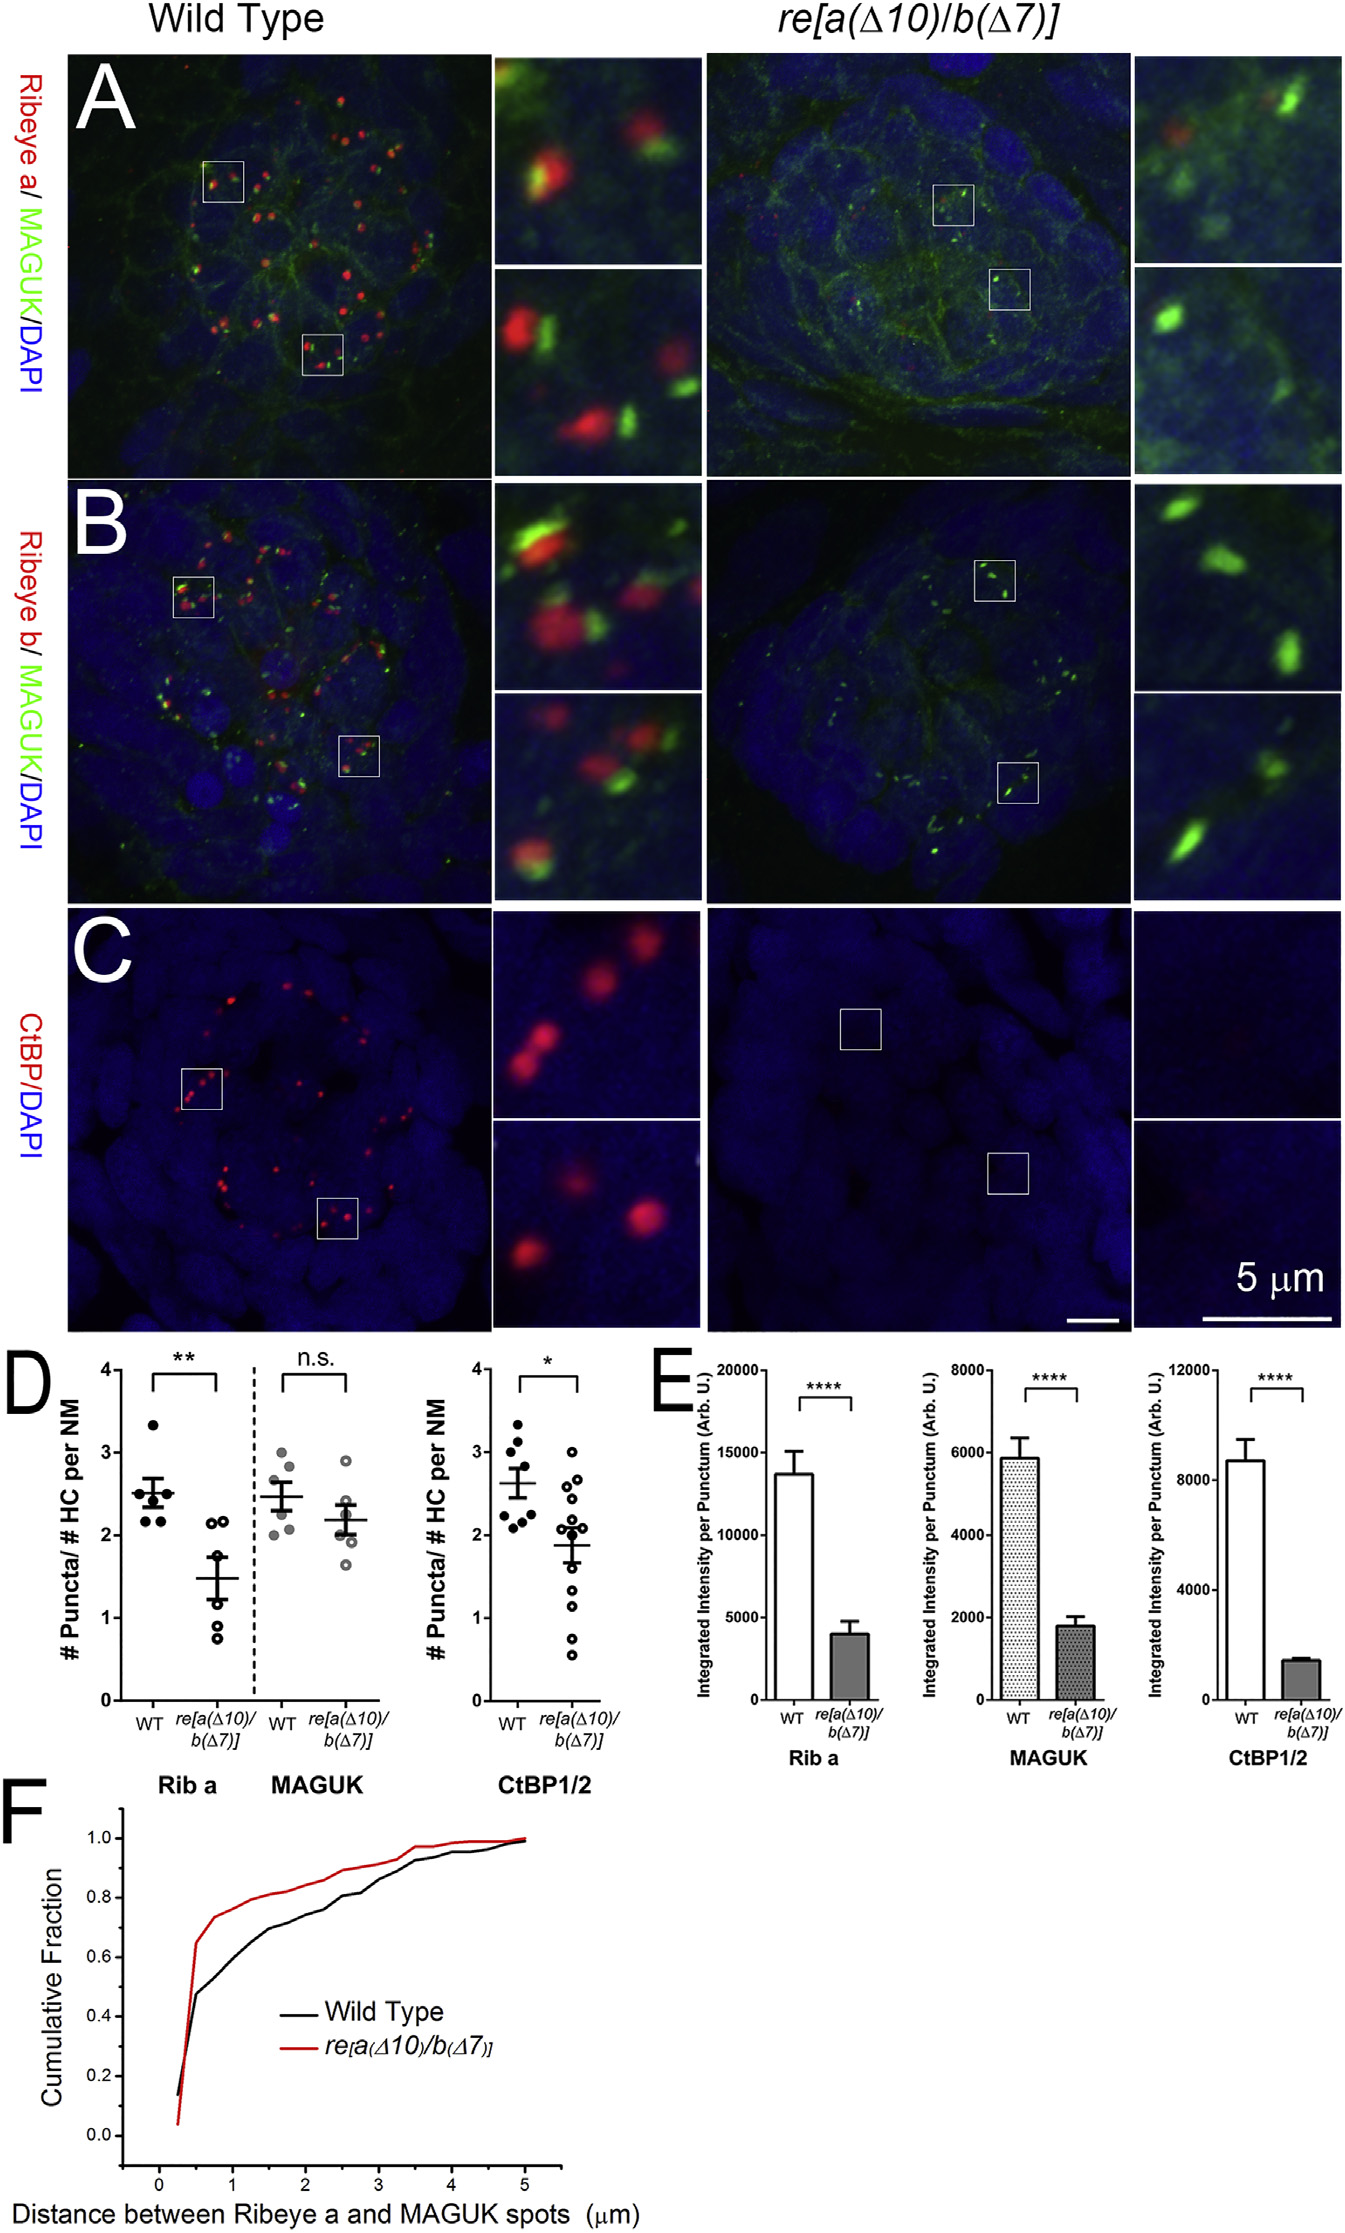
Ribeye Is Dramatically Reduced from Neuromast Hair Cells of re[a(Δ10)/b(Δ7)] Double Homozygous Mutants 5 dpf
(A) Confocal images of Ribeye A (red) and post-synaptic density marker pan-MAGUK (green) staining 5 dpf in WT (left) and re[a(Δ10)/b(Δ7)] homozygous mutant (right) neuromast. Insets show magnified images centered around synapses. Note the close apposition of Ribeye a and pan-MAGUK in WT animals, whereas little Ribeye a staining is found near pan-MAGUK in the re[a(Δ10)/b(Δ7)] double-homozygous mutants.
(B) Ribeye b (red) and pan-MAGUK (green) antibody staining in 5-dpf WT (left) and re[a(Δ10)/b(Δ7)] homozygous mutant (right) neuromast.
(C) CtBP antibody staining (green) in 5-dpf WT (left) and re[a(Δ10)/b(Δ7)] homozygous mutant (right) neuromast. DAPI (blue) stains nucleus. Scale bars, 5 mm.
(D) The number of Ribeye a, MAGUK, or CtBP1 immunolabeled puncta per hair cell in 5- to 6-dpf WT and re[a(Δ10/b(Δ7) mutants. Each circle represents an individual neuromast (NM) within a larva. The number of puncta per hair cell was approximated by dividing the number of Ribeye puncta within an NM by the number of hair cells in the NM. Error bars indicate SEM. Unpaired t test; **p = 0.0075; *p = 0.0226; n.s., not significant.
(E) Integrated intensities per punctum of Ribeye a, MAGUK, and CtBP1. Bars represent the means; error bars indicate SEM. Mann-Whitney U test; ***p < 0.0001, for both mutant alleles.
(F) Cumulative histogram of distances between Ribeye a spots to their nearest pan-MAGUK spot in confocal micrographs for WT (red) and re[a(Δ10/b(Δ7)] double-homozygous mutants (black).