
|
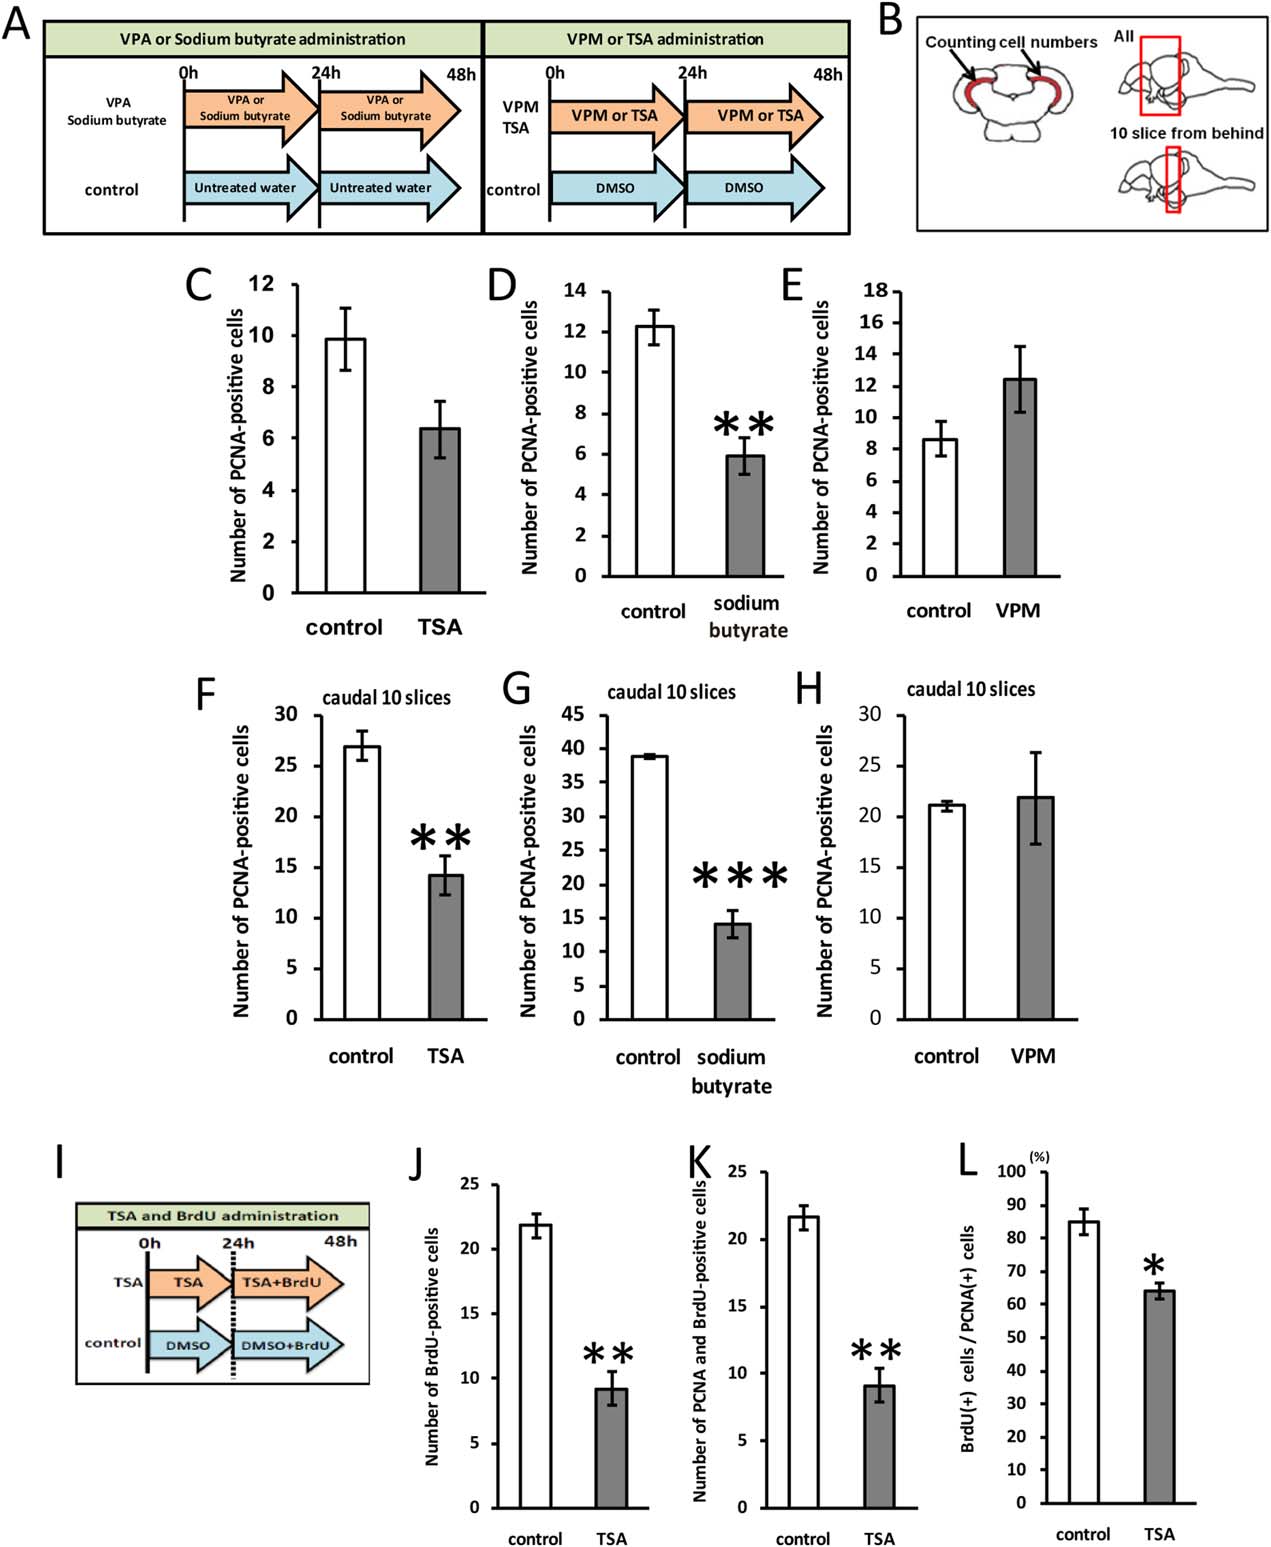
Fig. 5
HDAC inhibition suppresses cell proliferation in the optic tectum of adult zebrafish. A: Timeline of drug treatment. B: Method of quantification of cell number. C: Number of PCNA-positive cells in the zebrafish optic tectum with or without 400 nM TSA treatment (P = 0.075; control: n = 4; TSA: n = 4). D: Number of PCNA-positive cells in the zebrafish optic tectum with or without 13.6 µM sodium butyrate treatment (control: n = 3; sodium butyrate: n = 3). E: Number of PCNA-positive cells in the zebrafish optic tectum with or without 100 µM VPM (VPA analog) treatment (P = 0.21; control: n = 4; VPM: n = 3). F: Number of PCNA-positive cells in 10 caudal slices (control: n = 4; TSA: n = 4). G: The number of PCNA-positive cells in 10 caudal slices. (control: n = 3; sodium butyrate: n = 3). H: The number of PCNA-positive cells in 10 caudal slices (P=0.88; control: n = 4; VPM: n = 3). I: Timeline of drug treatment. J: Number of BrdU-positive cells in 10 caudal slices (control: n = 3; TSA: n = 3). K: Number of BrdU and PCNA double-positive cells in 10 caudal slices (control: n = 3; TSA: n = 3). L: Percentage of BrdU and HuC double-positive cells in BrdU-positive cells in 10 caudal slices (control: n = 3; TSA: n = 3). ***P < 0.001, **P < 0.01, *P < 0.05.