
Image
|
Figure Caption
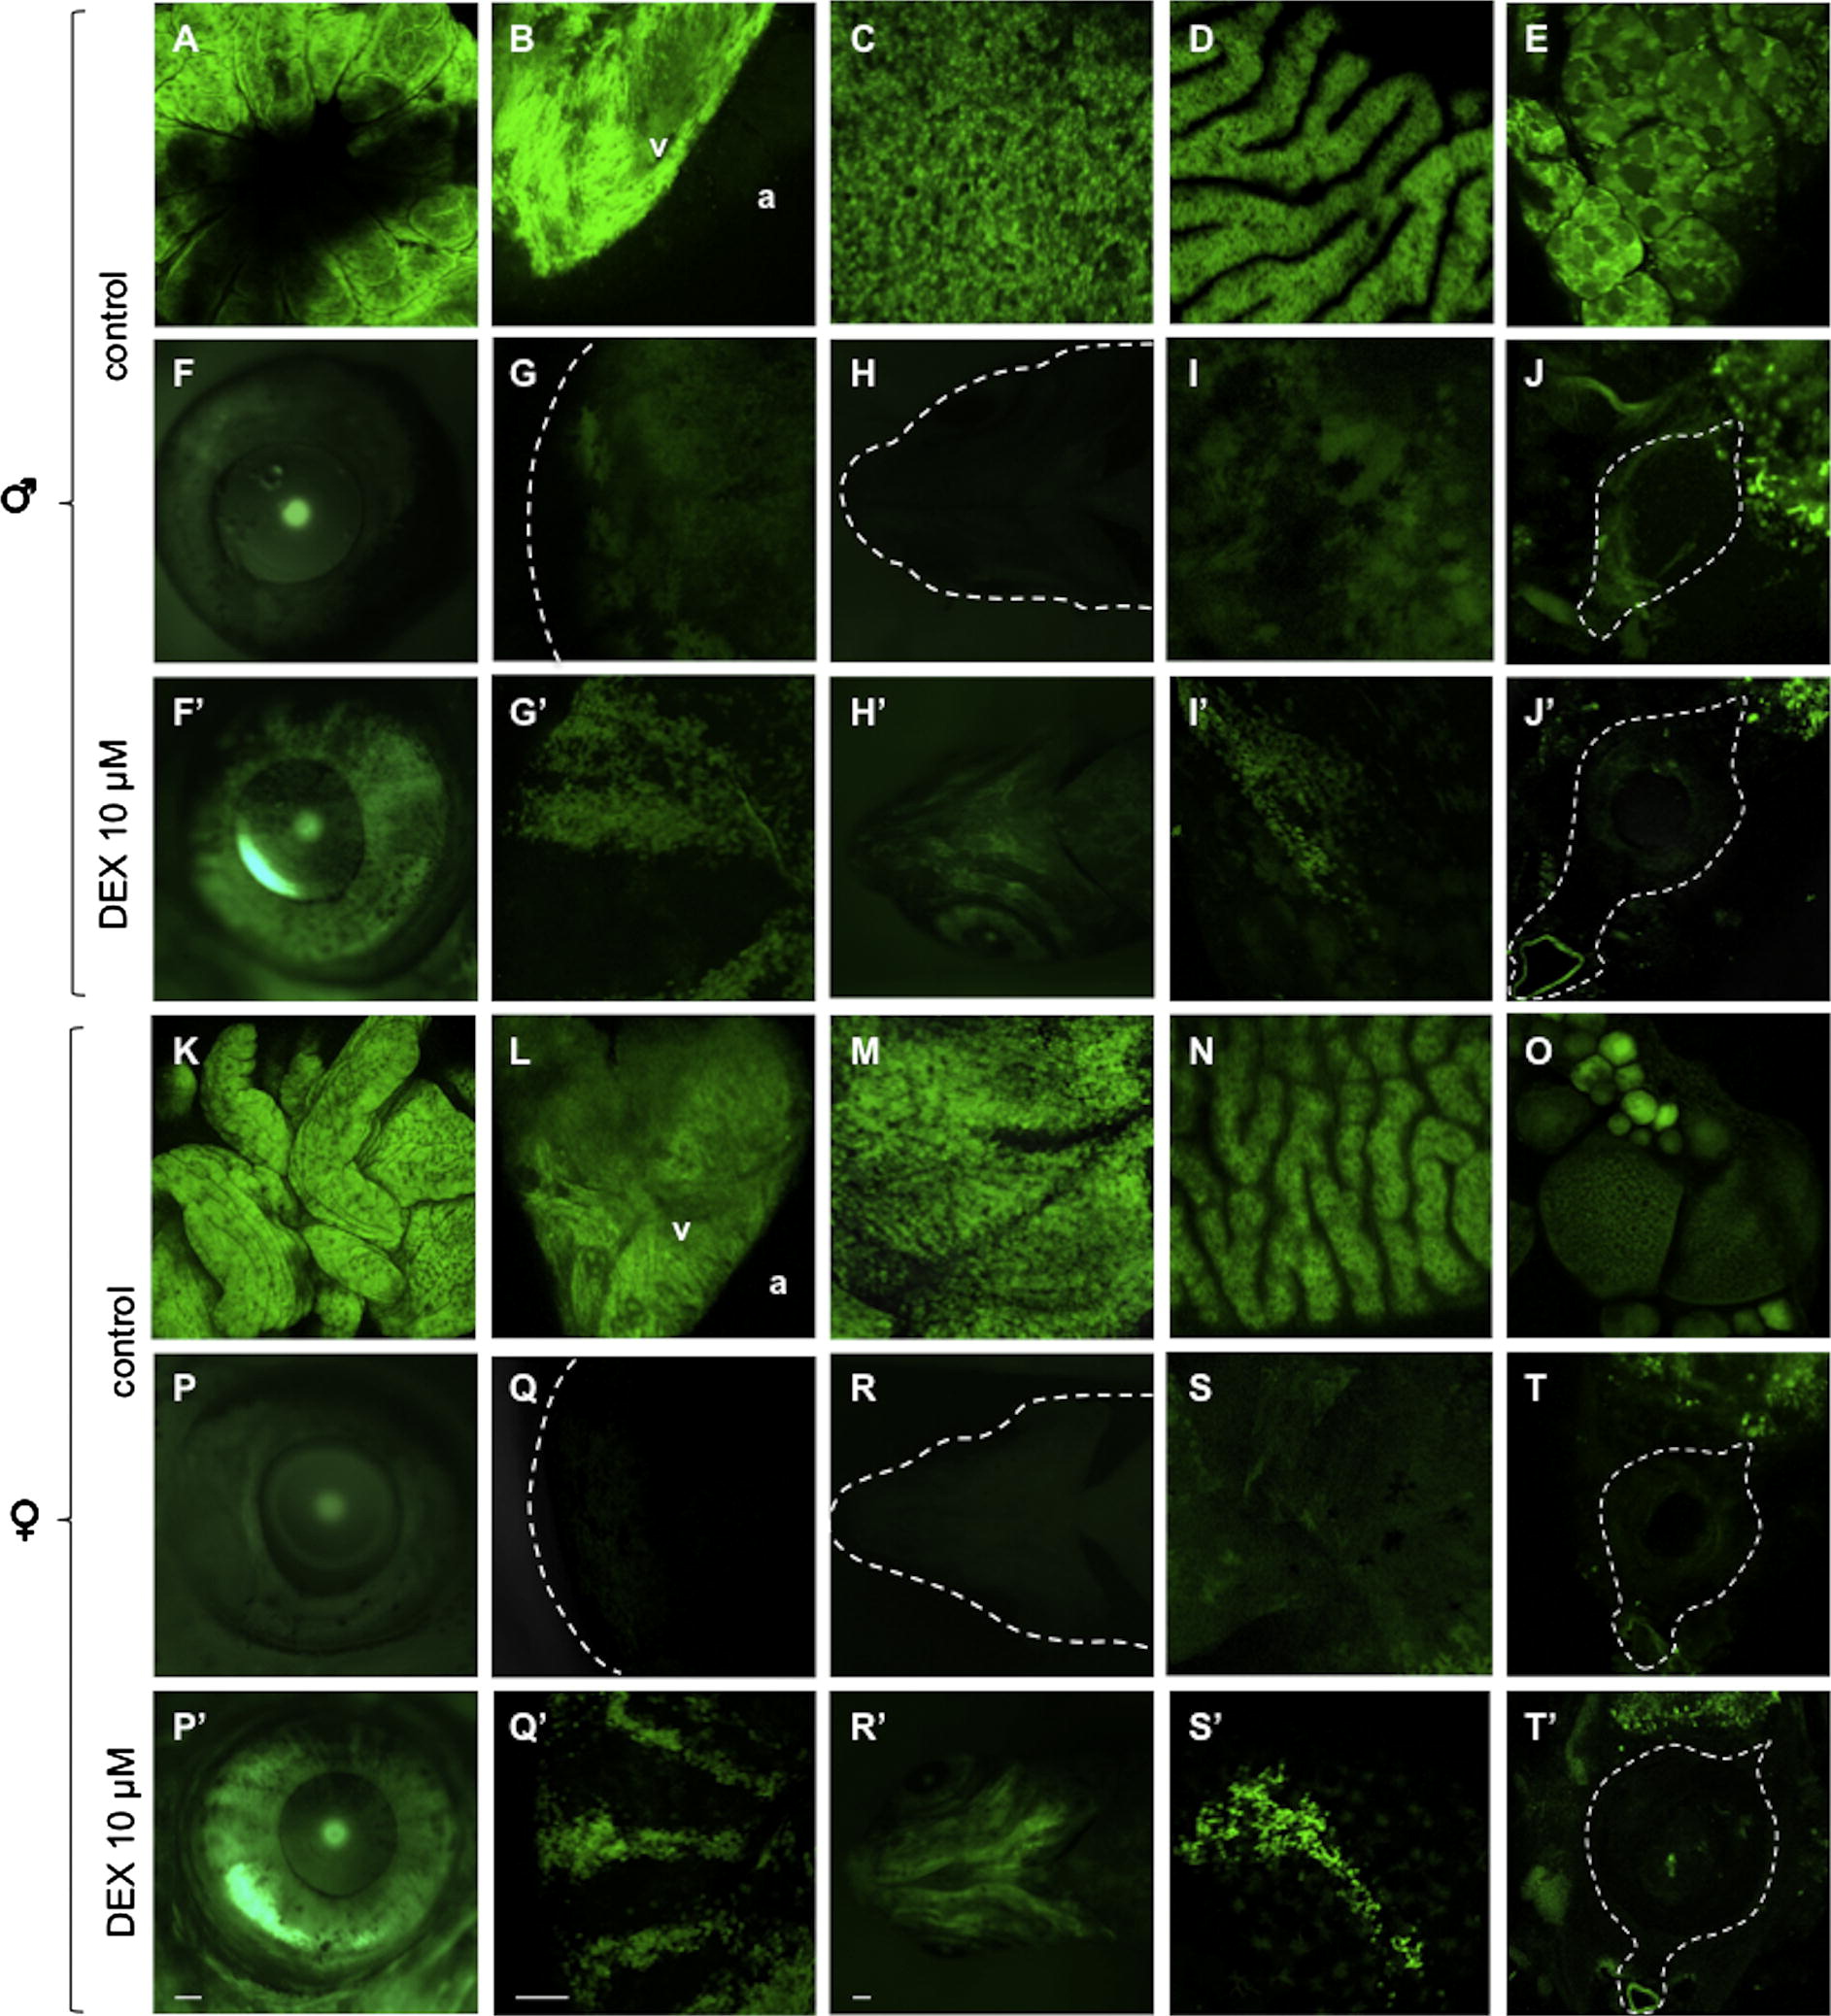
Fig. 7
20× Confocal microscopy pictures showing EGFP in control and 10 µM DEX-treated adult zebrafish males and females: esophageal sacs (A and K), ventricular epicardium (B and L; v = ventricle; a = atrium), liver (C and M), intestinal mucosa (D and N), testis (E), ovary (O), eye (F and G, F′ and G′; P and Q, P′ and Q′), skeletal elements of the splanchnocranium (H′, R′), skin (I, I′, S, S′) and spinal cord (J, J′, T, T′). Scale bar: 200 µM.
Figure Data
Acknowledgments
This image is the copyrighted work of the attributed author or publisher, and
ZFIN has permission only to display this image to its users.
Additional permissions should be obtained from the applicable author or publisher of the image.
Reprinted from Molecular and Cellular Endocrinology, 392(1-2), Benato, F., Colletti, E., Skobo, T., Moro, E., Colombo, L., Argenton, F., Dalla Valle, L., A living biosensor model to dynamically trace glucocorticoid transcriptional activity during development and adult life in zebrafish, 60-72, Copyright (2014) with permission from Elsevier. Full text @ Mol. Cell. Endocrinol.