
|
Fig. 2
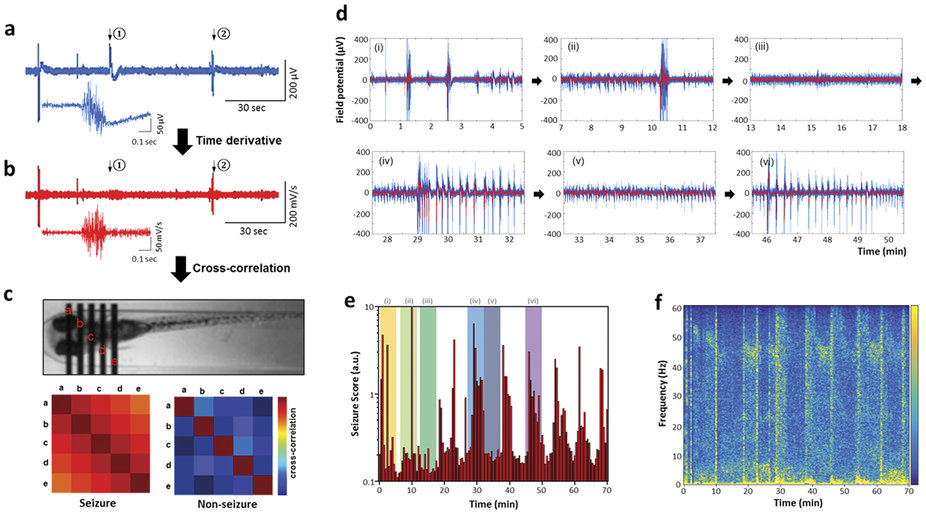
Electrographic seizure recording and seizure score algorithm.
(a) An electroencephalograph recorded from a surface electrode contacted to a zebrafish head. A zoomed electrograph was shown for the instance noted as ②. (b) Corresponding time-derivative of electrograph in (a). A zoomed time-derivate was shown for the instance ②. (c) Cross-correlation between time-derivatives of spatially distributed five electrode signals. The seizure score is a summation of the off-diagonal numbers of the cross-correlation set and can effectively screen out non-seizure-like electrographic signals like ①. (d) Representative EEG episodes of a PTZ-induced epilepsy model showing ictal- and interictal-like bursts. The red line is averaged from nearby 10 data point attached as 1 kHz. (e) Seizure score vs. time plot for the PTZ-induced epilepsy model. Time spans for the representative EEG episodes are indicated as Roman numerals. (f) Corresponding EEG spectra vs. time.