
|
Fig. 5
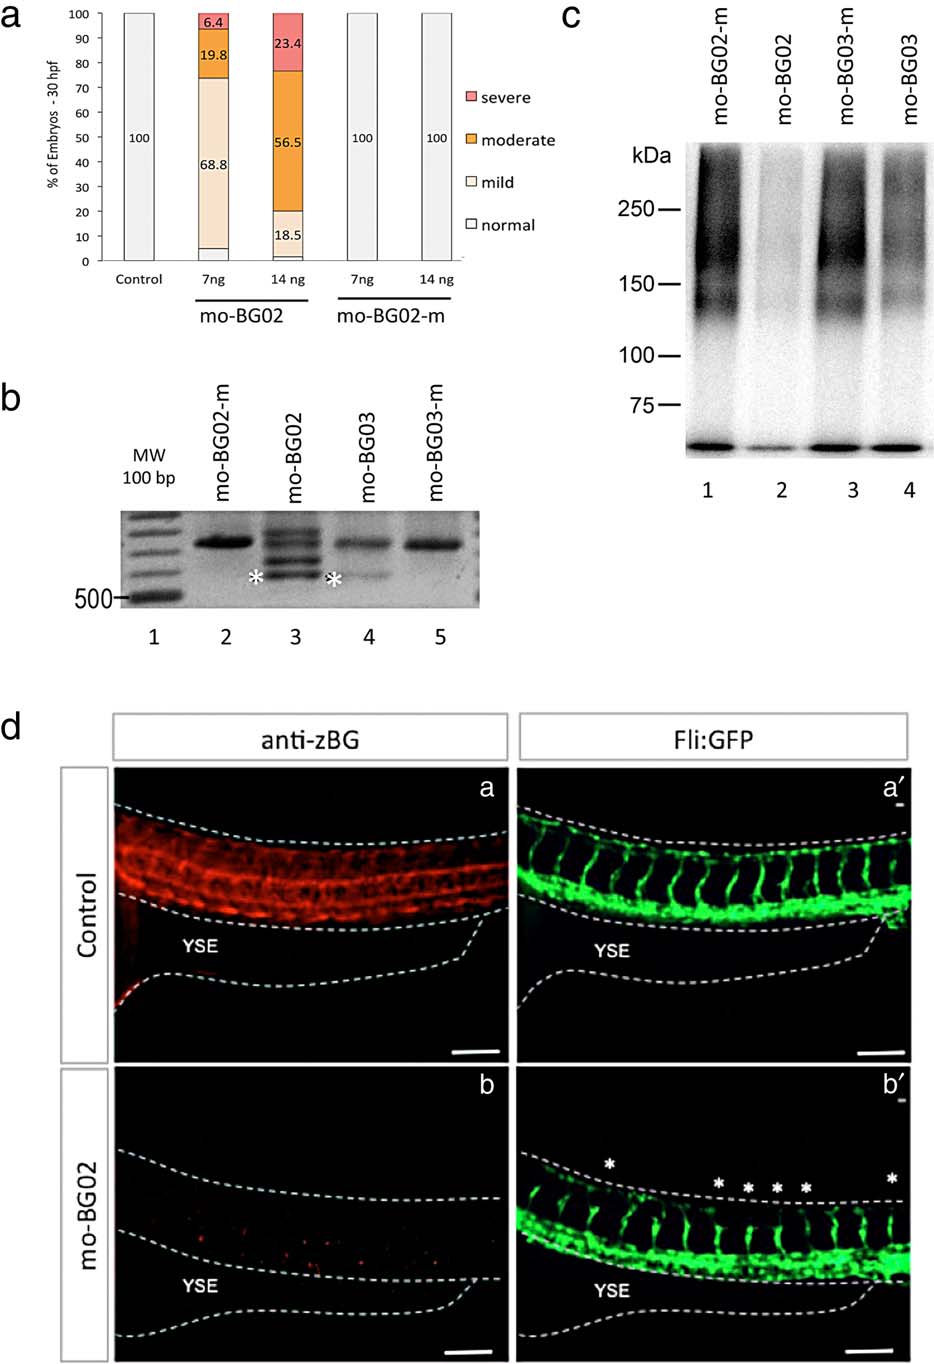
Morpholino BG knockdown. (a) Graph showing the effects of two different doses of mo-BG02 (7 and 14 ng) and its mismatch-control. Results are expressed as percentage of the total embryos in each category (mild, moderate, and severe), evaluated at 36 hpf. Morpholino identity and concentration are indicated in the horizontal axis. (b): Agarose gel showing the effects of mo-BG02, mo-BG03, and their mismatched controls on BG pre-mRNA splicing. TW embryos were injected with the indicated morpholinos, and total RNA was isolated at 72 hpf from 25 pooled embryos in each condition. Samples were processed for RT-PCR with primers 3.13 and 3.20 as described in experimental procedures. A single band corresponding to the expected 738 bp was obtained from embryos injected with control mismatch morpholinos (lanes 2 and 5). Injection with 7 ng of mo-BG02 (lane 3) produced the expected exon2-deletion product of 510 bp (band at asterisk) as well as several larger products (bands above asterisk) that correspond to aberrantly spliced mRNAs (see text). Injection of 30 ng of mo-BG03 (lane 4) produced the 510 bp PCR product (asterisk), but also large amounts of the WT product of 738 bp. (c) Autoradiography of acrylamide gel showing the effects of mo-BG02, mo-BG03, and their mismatched controls on the endogenous zBG protein. Wild type embryos were injected with the indicated morpholinos, total protein extracts were obtained at 72 hpf, and processed for TGF-β2 affinity labeling and immunoprecipitation with rabbit anti-BG serum # 31 as described in Materials and Methods and Supporting Information Figure S1. Treatments are as follow: mo-BG02-mismatch 7 ng (lane 1), mo-BG02 7 ng (lane 2), mo-BG03-mismatch 30 ng (lane 3), and mo-BG03 30 ng (lane 4). (d) IHC with anti-serum against zebrafish BG in wild type and morphant embryos. Lateral views of the trunk of Tg(fli:EGFP)y1 embryos the level of caudal limit of the YSE at at 36 hpf. Dotted lines were added to help identify the embryo limits. Anterior is to the left, dorsal to top. (d-a): Control embryo showing BG expression as described in Figure 3-III. (d-a′): the same embryo showing GFP expression in trunk vessels that have developed normally. (d-b): Mild morphant embryo injected with 7 ng mo-BG02 (mo-BG02) showed no expression of BG. (d-b′): the same embryo showing GFP expression in trunk vessels revealed the morphant phenotype of abnormal ISV development (asterisks).