
|
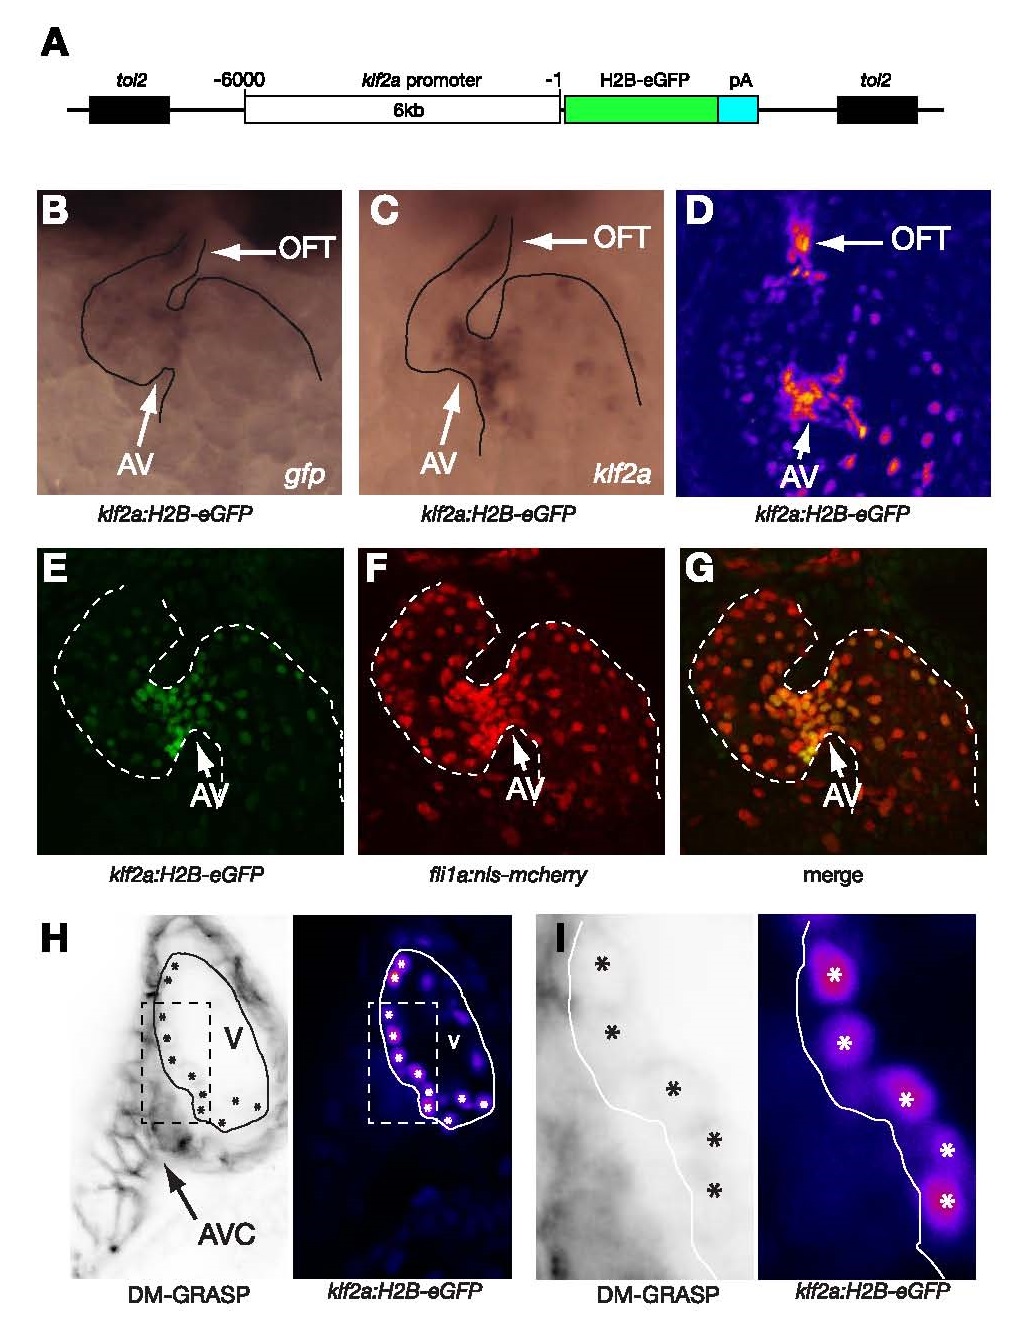
Fig. S1
Zebrafish klf2a reporter line. A. Generation of the Tg(klf2a:H2B-eGFP) line. A 6 kb fragment of the region upstream of klf2a ATG located between -1 and -6000 bp (with the ATG being considered as 0 in the drawing) was cloned into a PCAAGS vector containing a cassette driving H2B-eGFP expression and the tol2 sites. Several founders were obtained and only two were kept for further analysis. As both of them recapitulated the same expression pattern, only one line was maintained for the study. (B-C) gfp and klf2a whole mount in situ hybridization (ISH) expression in larvae at 2 dpf. Frontal views reveal staining of the outflow tract (OFT) and the atrio ventricular canal (AVC). (D) Maximum intensity projection of a confocal stack of Tg(klf2a:H2B-eGFP) larva revealing GFP expression in the atrioventricular canal and the outflow tract at 52 hpf. (E-G) Maximum intensity projection of a confocal stack of Tg(klf2a:H2B-eGFP;fli:nls-mcherry). The Tg(klf2a:H2B-eGFP) (E) and the Tg(fli1a:nls-mcherry) which is specifically expressed in the endocardial cell layer (F) display a strict co-localised expression in the merge (G). This reveals the specificity of expression Tg(klf2a:H2B-eGFP) in the endocardium. (H-I) Maximum projection of the outside curvature of the ventricle after immunohistochemistry done with DM-GRASP antibodies labeling the endocardial and myocardial AVC cells in the Tg(klf2a:H2B-eGFP). The expression of DM GRASP and H2B EGFP co-localises in this area, thereby showing that cells of the outer curvature of the ventricular endocardium are part of the AVC.