
|
Fig. 3
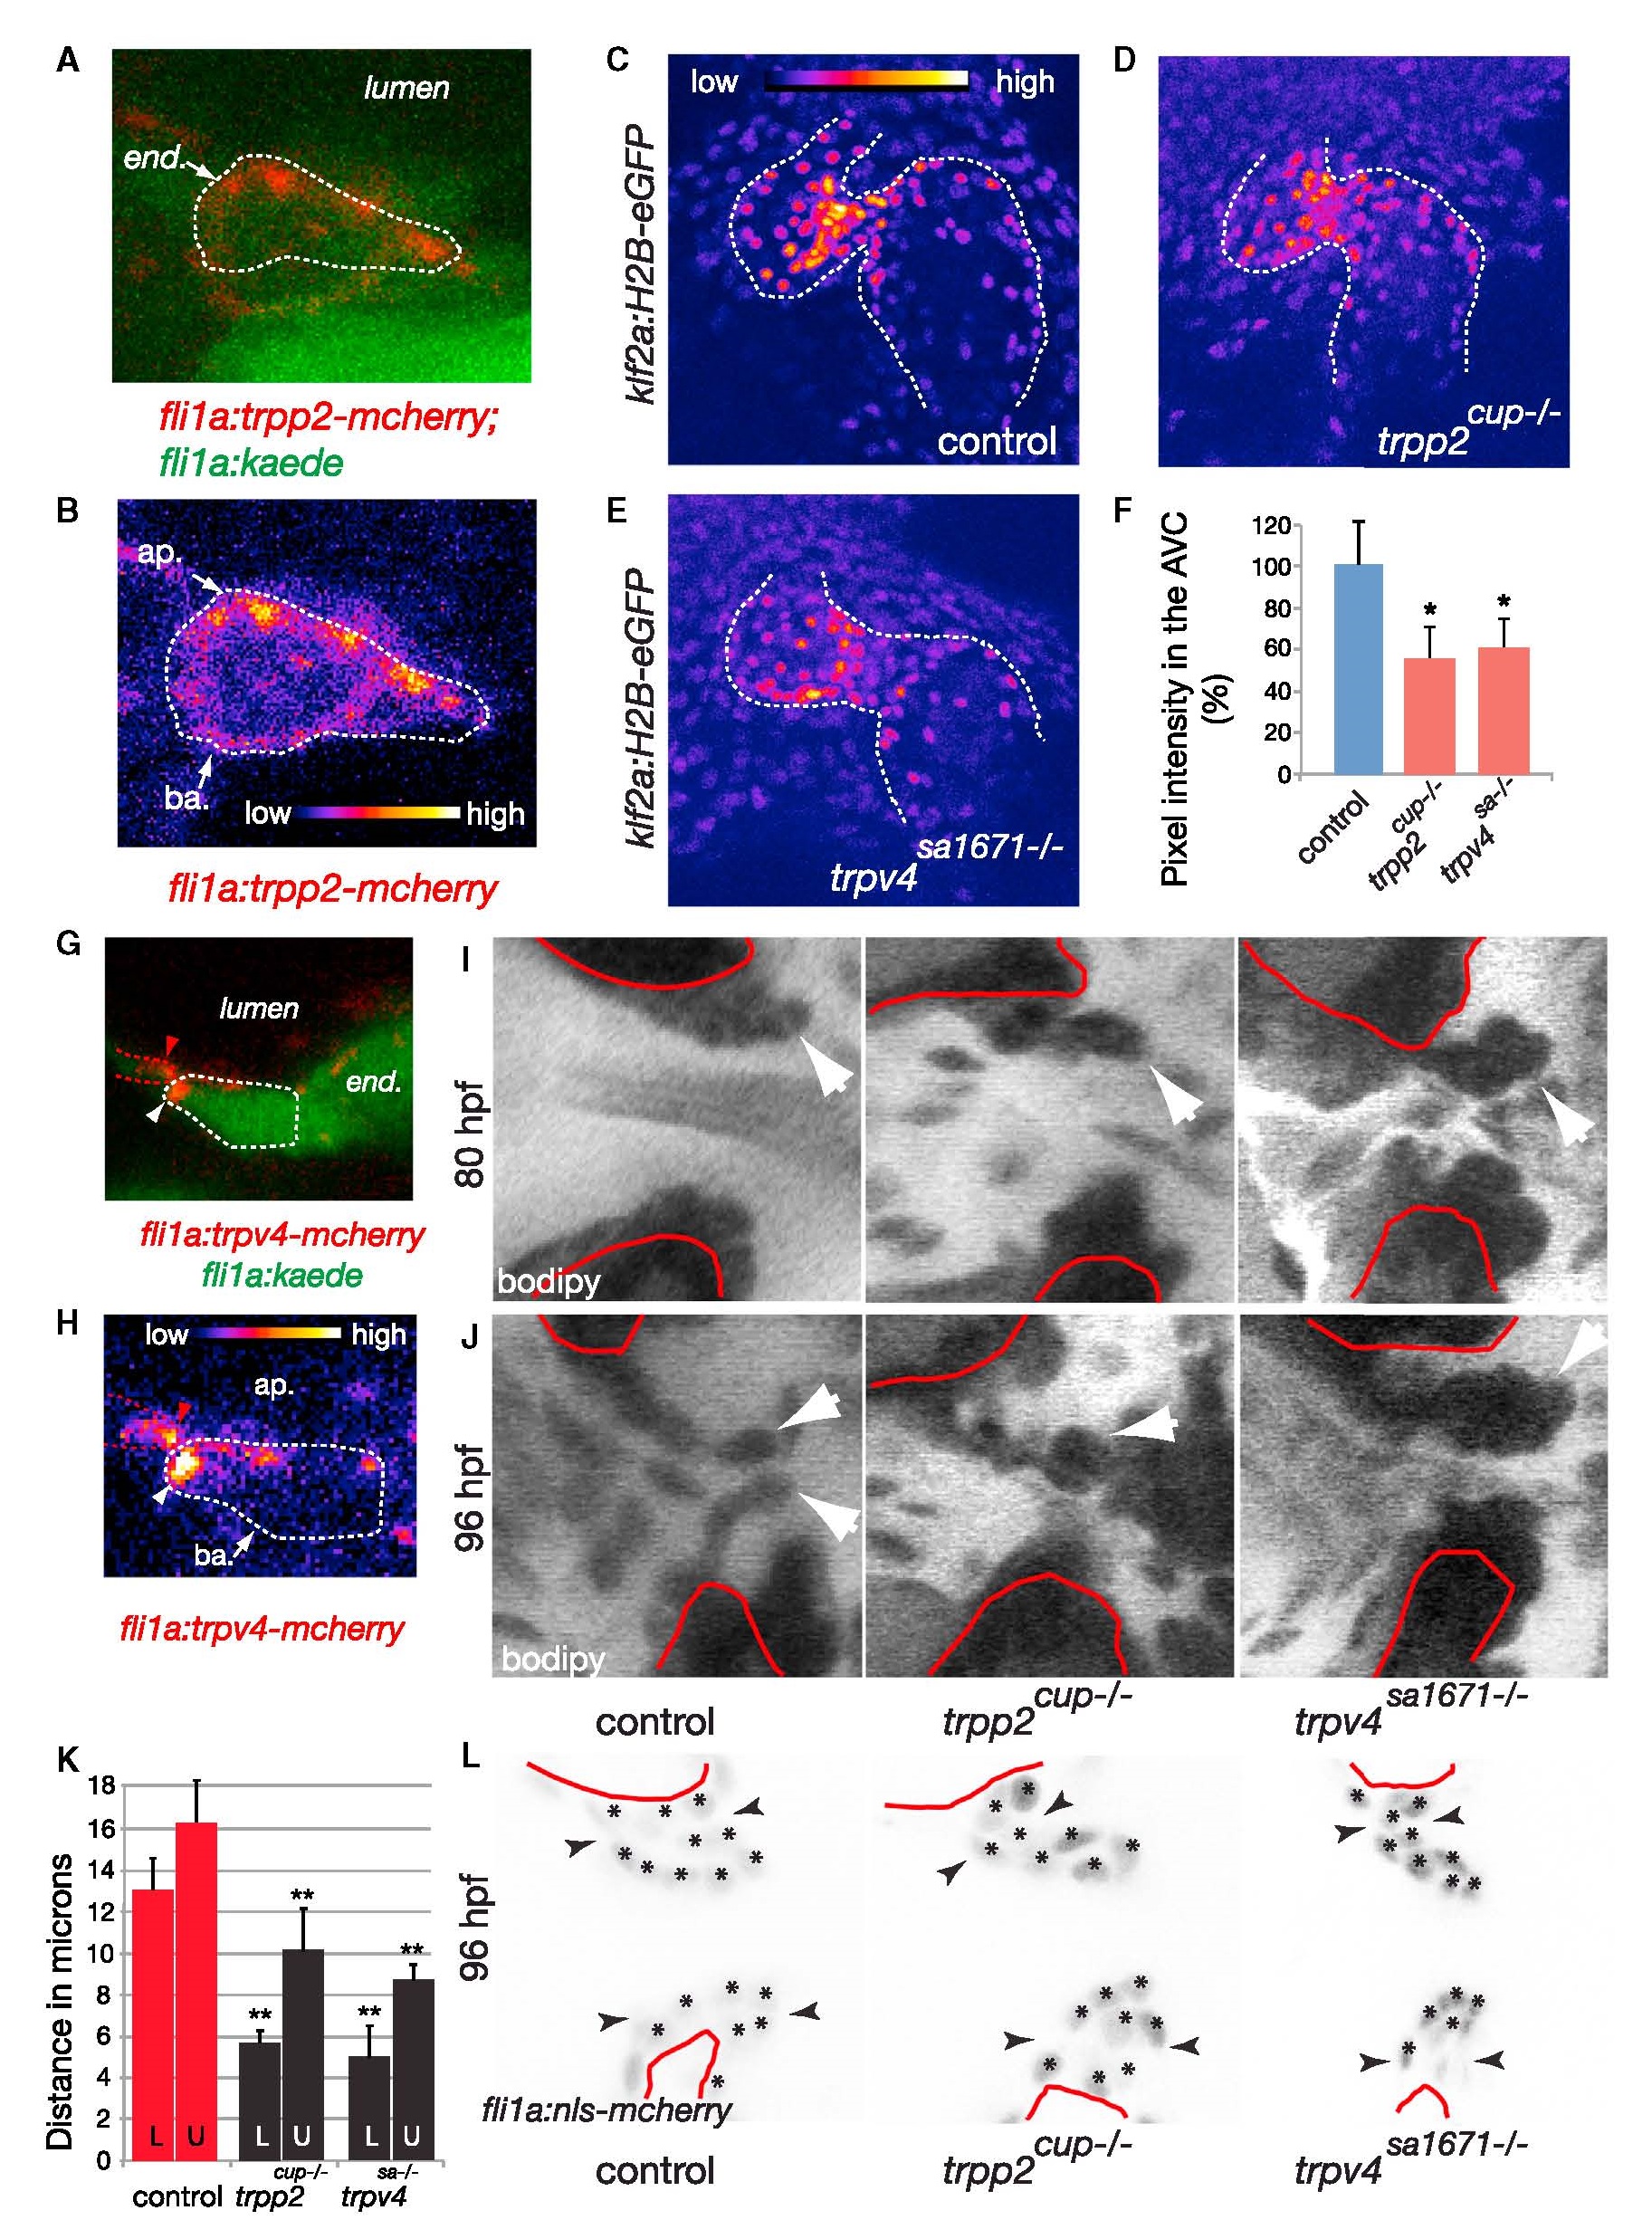
Trrp2 and Trpv4 Are Essential for klf2a Expression and Heart Valve Development
(A) Subcellular distribution of Trpp2 in the endocardium (Tg(fli1a:kaede) in green) and of Tg(fli1a:trpp2-mcherry) in red.
(B) Zoom on the Tg(fli1a:trpp2-mcherry) endocardial cell (FireLUT).
(C and D) Tg(klf2a:H2B-eGFP) expression level in trpp2cup-/- embryos (n = 6) is lower than in the control (n = 10) in the endocardium (C) and corresponds to a 45% decrease in klf2a:H2B-eGFP expression after pixel intensity measurement at 48 hpf (D).
(E and F) trpv4sa1671-/- (n = 6) also displays a significant decrease of the klf2a transgene intensity in the AVC (38% decrease) compared to the control at 48 hpf. (E) Quantification of the fluorescence intensity of the H2B-eGFP in the controls, trpp2cup-/-, and trpv4sa1671-/- mutants at 48 hpf. *p < 0.05; **p < 0.01 ANOVA. Error bars indicate the SD.
(G and H) Subcellular distribution of Trpv4 in the endocardium (Tg(fli1a:kaede) in green) and of Tg(fli1a:trpv4-mcherry) in red. (H) Zoom on the Tg(fli1a:trpv4-mcherry) endocardial cell (LUT fire). Endocardial cells are highlighted with dotted lines showing Trpv4 channels are enriched apically.
(I and J) Heart valve defects in trpp2cup-/- and trpv4sa1671-/- at 80 and 96 hpf. The tip of the valve is highlighted by the white arrows, and the red lines indicate the separation between the myocardium and endocardium.
(K) Length of the base of the upper (U) and lower (L) valve in the section plan (shown with the black arrows in K) showing the shape base of the valve is affected in the trpp2 and trpv4 mutants at 96 hpf. **p < 0.01 ANOVA. Error bars indicate the SD.
(L) Nuclear labeling of the endocardial cells located in the AVC and forming the valve leaflets at 96 hpf in controls, trpp2cup-/-, and trpv4sa1671-/-; Tg(fli1a:nls-mcherry) mutants showing the cellular localization in normal and mutant valves. The black arrows point to the base of the upper and lower valves.
ap., apical; ba., basal; end., endocardium; myoc., myocardium (A, B, I, and J). See also Figure S3 and Movie S4.