
|
Fig. 1
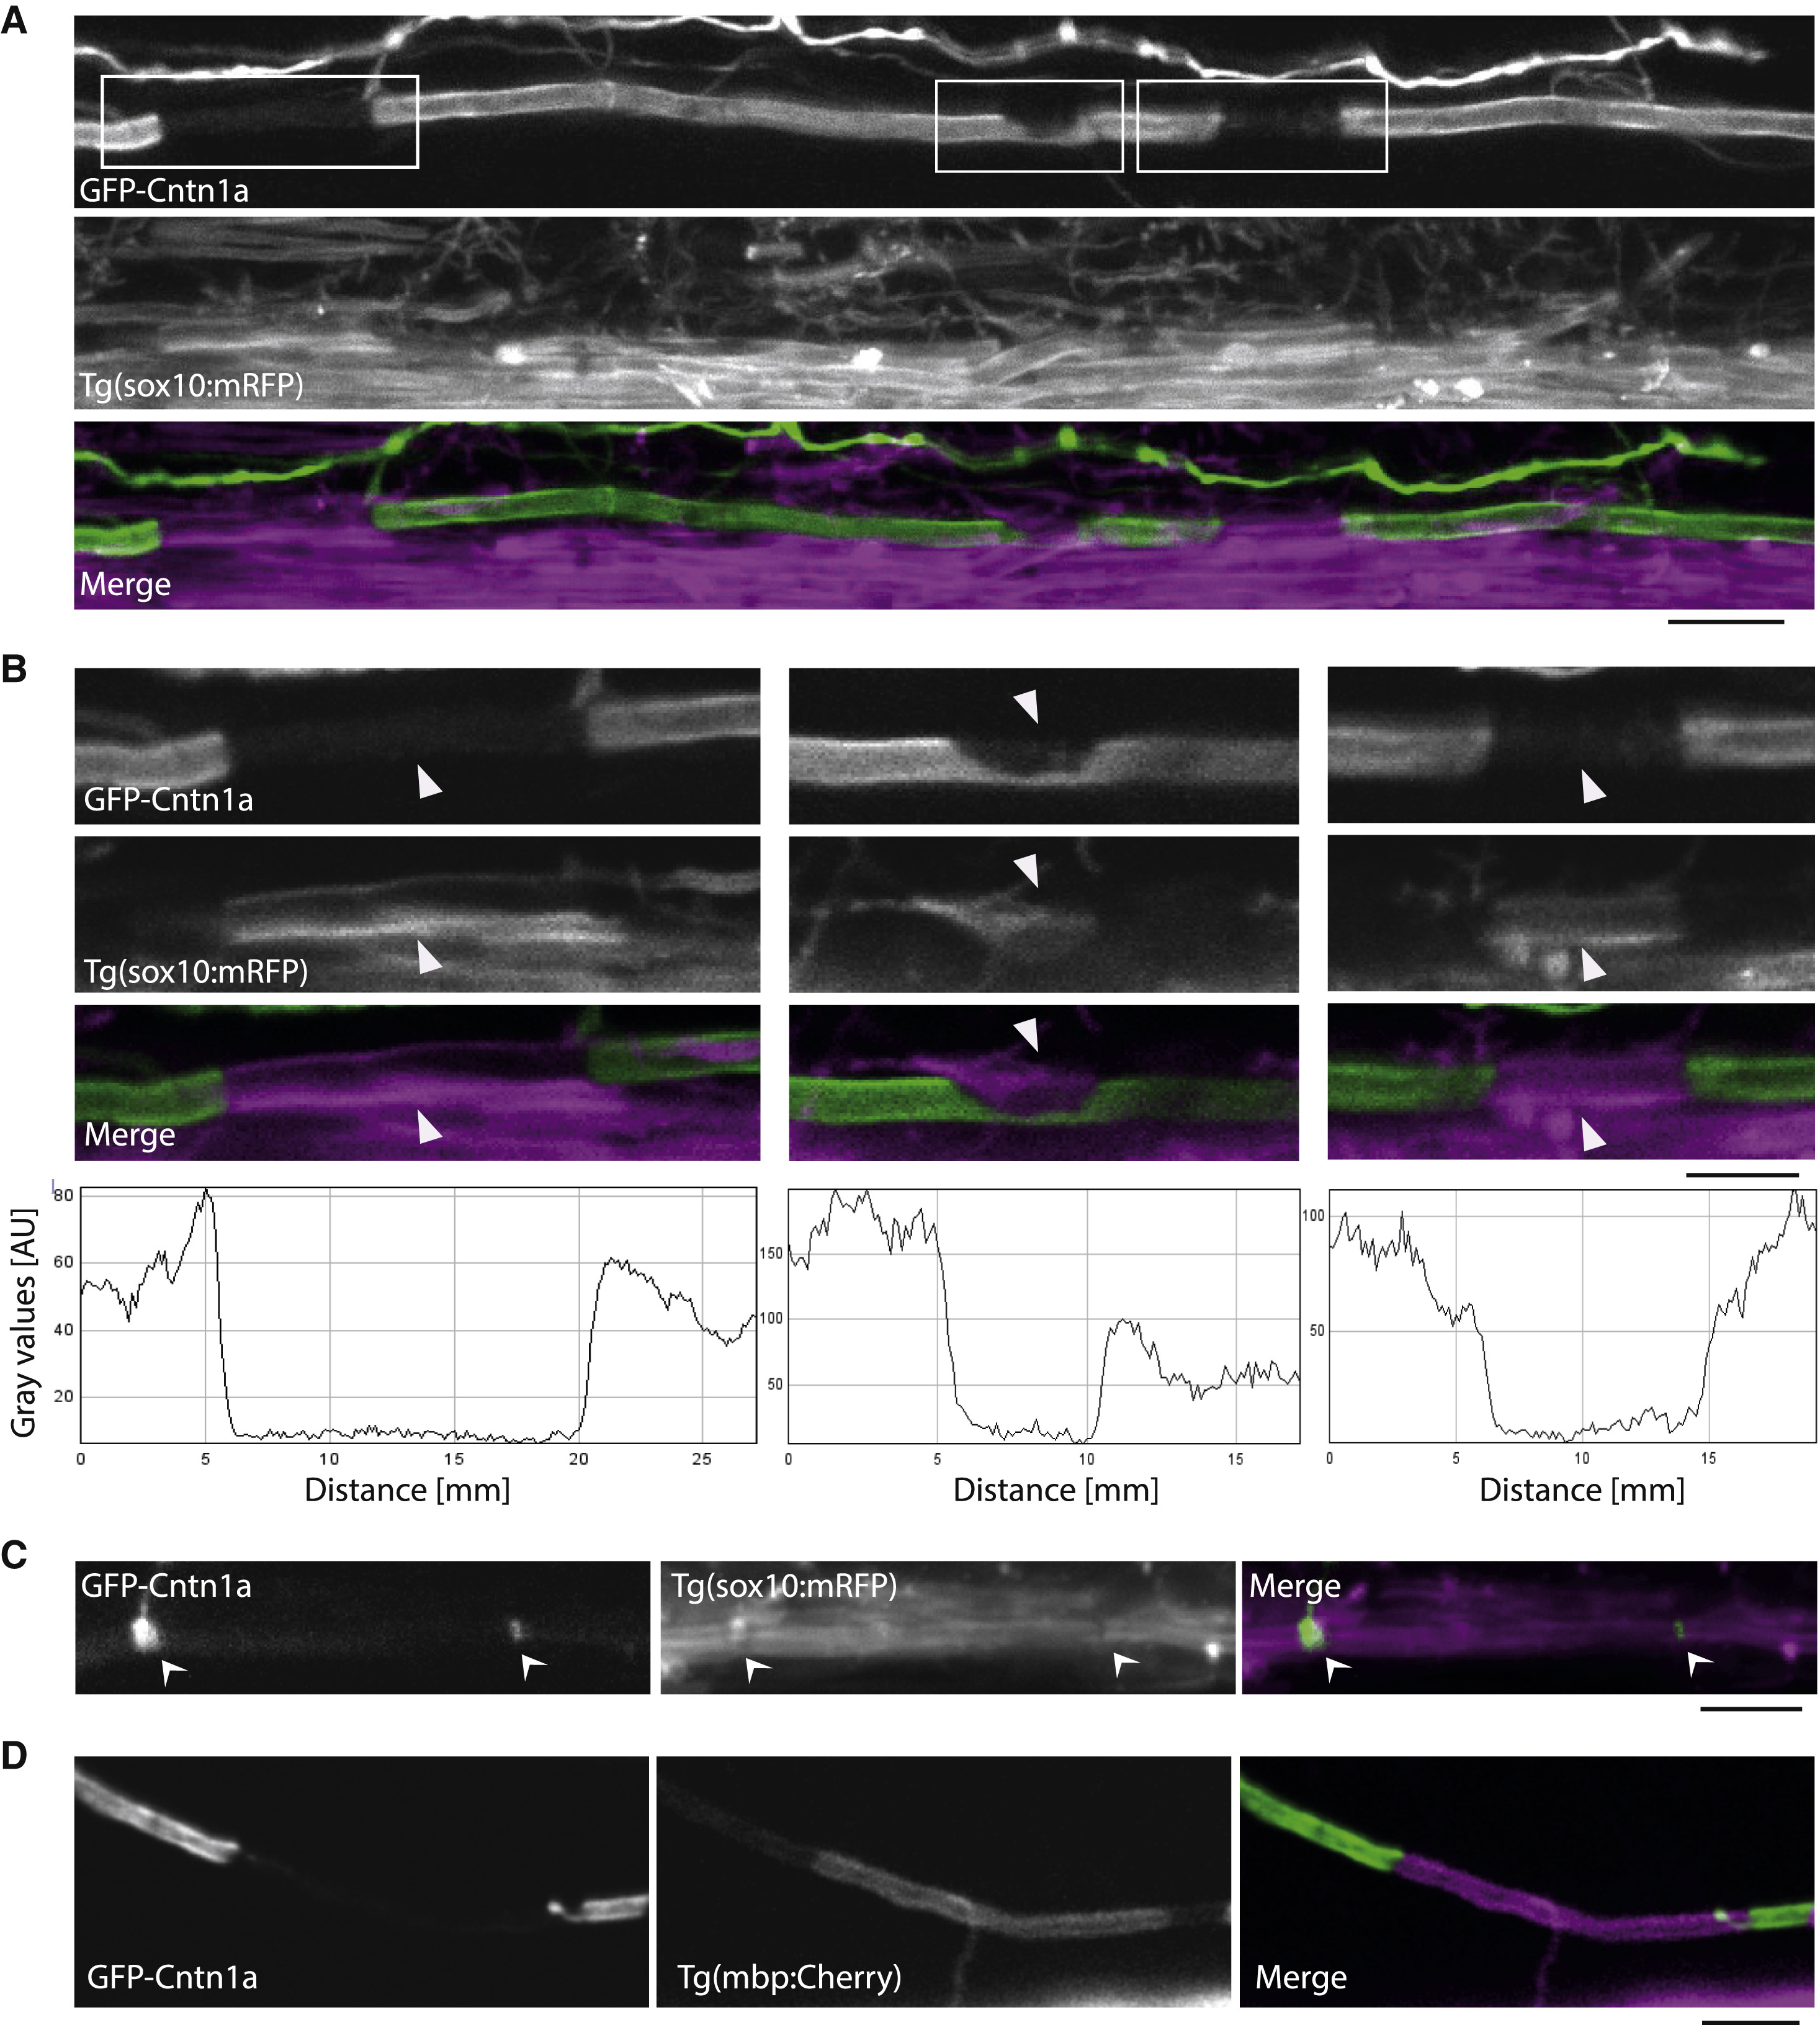
GFP-Cntn1a as a Tool to Visualize Myelin Sheaths along Single Axons
(A) Reticulospinal axon labeled with GFP-Cntn1a (top) in a Tg(sox10:mRFP) embryo, which labels oligodendrocytes and their myelin sheaths (middle). The myelin sheaths along the reticulospinal axon are localized to the gaps in GFP expression. Scale bar, 20 µm.
(B) High-magnification views of areas outlined in (A) (top). Scale bar, 5 µm. GFP-Cntn1a fluorescent intensity profiles of the insets from (A) (bottom).
(C) GFP-Cntn1a expression clustered at putative nodes of Ranvier (left) (arrows), as indicated by gaps in Tg(sox10:mRFP) expression (middle and right). Scale bar, 20 µm.
(D) GFP-Cntn1A along a CoPA axon in a Tg(mbp:mCherry-CAAX) embryo at 4 dpf shows expression of the myelin reporter in the gap of GFP-Cntn1A localization. Scale bar, 5 µm. See also Figures S1 and S2 and Table S1.