
Fig. 1
- ID
- ZDB-IMAGE-160708-1
- Genes
- Publication
- He et al., 2016 - Synergy between loss of NF1 and overexpression of MYCN in neuroblastoma is mediated by the GAP-related domain
- All Figures
- Figures for He et al., 2016
|
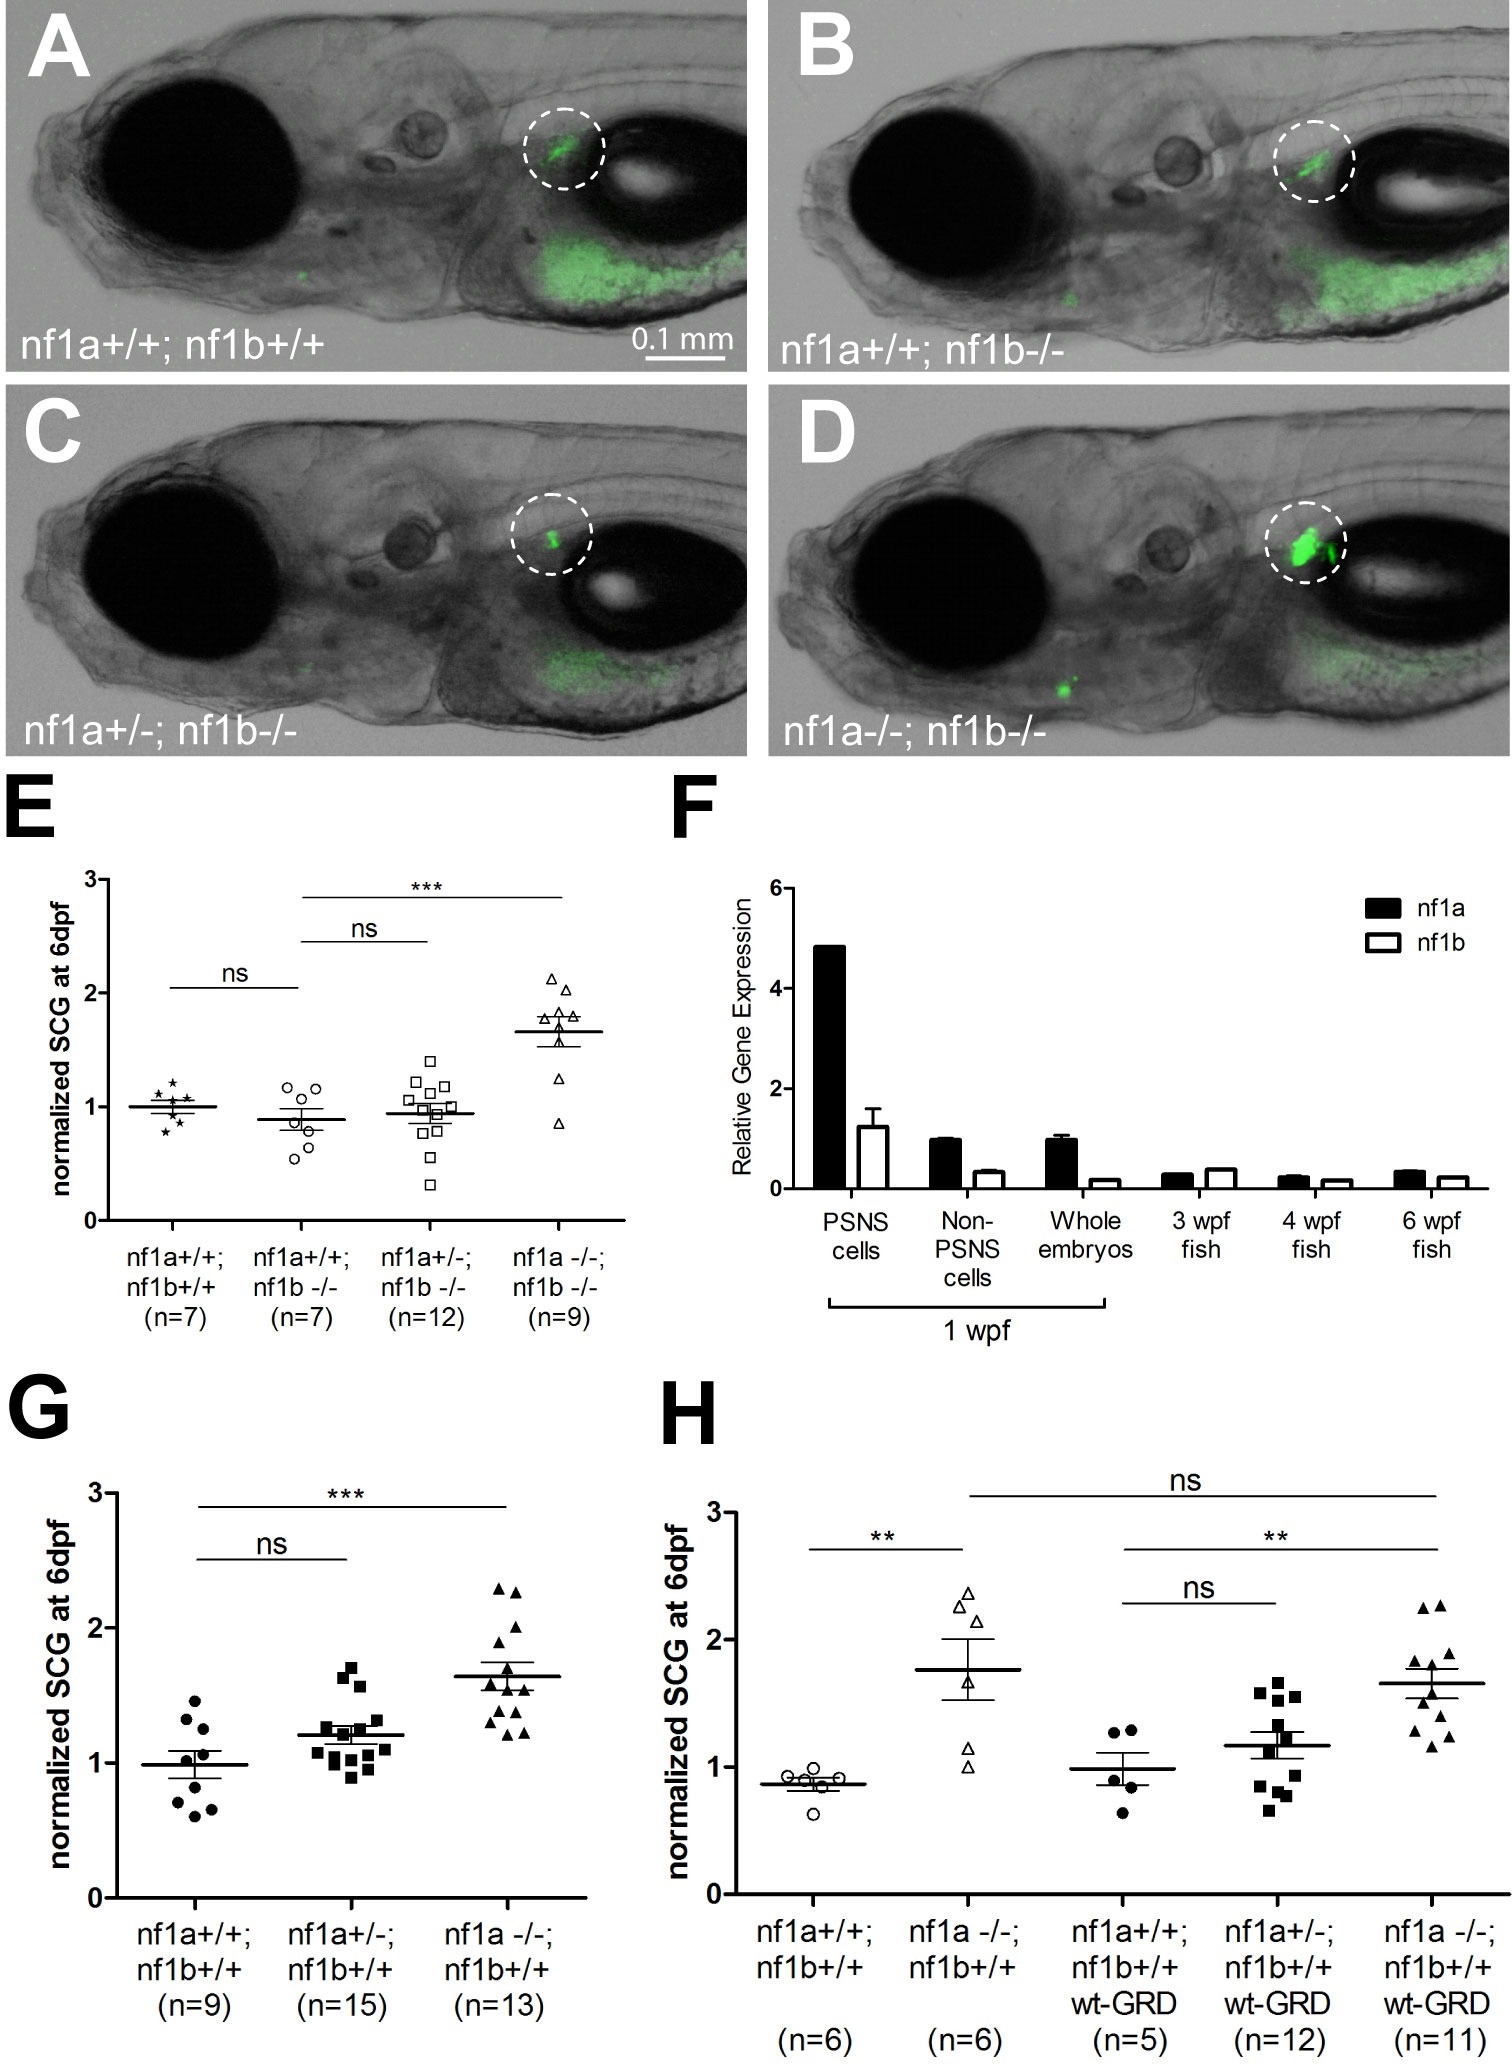
Fig. 1
The GRD domain of NF1 cannot rescue the PSNS overgrowth in nf1 deficient zebrafish.
(A-D) Development of superior cervical ganglia (SCG, highlighted by dotted circles) in representative embryos of nf1a+/+;nf1b+/+;GFP, nf1a+/+;nf1b-/-;GFP, nf1a+/-;nf1b-/-;GFP and nf1a-/-;nf1b-/-;GFP genotypes at the age of 6 days postfertilization (dpf). (E) Quantification of GFP+ cells in the SCG of embryos of nf1a+/+;nf1b+/+;GFP (n = 7), nf1a+/+;nf1b-/-;GFP (n = 7), nf1a+/-;nf1b-/-;GFP (n = 12) and nf1a-/-;nf1b-/-;GFP (n = 9) genotypes at the age of 6 dpf. (F) Quantitative RT-PCR showing the relative expression levels of nf1a and nf1b in the PSNS of zebrafish embryos and juveniles. 1-week-old dbh:mCherry embryos (n = 200) were pooled, dissociated and FACS sorted to obtain PSNS (mCherry+) and non-PSNS (mCherry-) cells for analysis. RNA of whole embryos from the same clutch of eggs were also analyzed. RNAs from whole juvenile zebrafish at the ages of 3, 4, and 6 weeks were also examined by quantitative RT-PCR. (G) Quantification of GFP+ cells in the SCG of embryos of nf1a+/+;nf1b+/+;GFP (n = 9), nf1a+/-;nf1b+/+;GFP (n = 15) and nf1a-/-;nf1b+/+;GFP (n = 13) genotypes at the age of 6 dpf. (H) Quantification of GFP+ cells in the SCG of embryos of nf1a+/+;nf1b+/+;GFP (n = 6), nf1a-/-;nf1b+/+;GFP (n = 6), nf1a+/+;nf1b+/+;GFP;wt-GRD;mCherry (n = 5), nf1a+/-;nf1b+/+;GFP;wt-GRD;mCherry (n = 12) and nf1a-/-;nf1b+/+;GFP;wt-GRD;mCherry (n = 11) genotypes at the age of 6 dpf. **p<0.01, ***p<0.001 by two-tailed unpaired t-test.