
|
Fig. S4
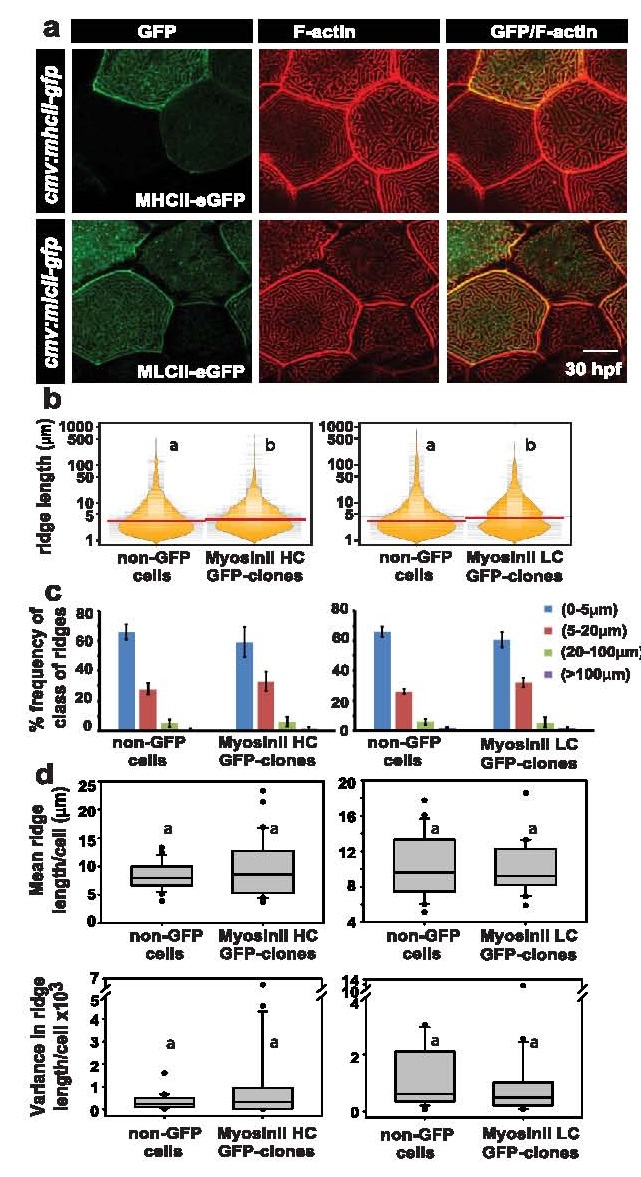
Over-expression of heavy and light chains of MyosinII does not cause significant changes in ridge lengths. Confocal images of wild-type embryos injected with cmv:mhcII-gfp or cmv:mlcII-gfp and stained for GFP and F-actin at 30 hpf (a). Visualisation of the distribution of the ridge lengths and medians of the clones over-expressing cmv:mhcII-gfp or cmv:mlcII-gfp and the neighbouring non-GFP cells using bean plots (b). The percentage frequency distribution of ridges in short (0-5 µm), intermediate (5-20 µm), long (20-100 µm) and very long (>100 µm) categories (c), as well as estimation of mean and variance in ridge length for individual cells and comparison of their distributions (d) using box-whisker plots. Quantifications in (b), (c) and (d) are based on embryos injected with cmv:mhcII-gfp or cmv:mlcII-gfp and stained for GFP and F-actin at 30 hpf.
Distributions represented with different alphabets show significant difference in median values at p<0.05 by pairwise multiple comparison procedures using Dunn′s Method. Error bars in (c) are for the standard deviation. Scale bar =10 µm. Abbreviations: MHCII: MyosinII heavy chain; MLCII: MyosinII Light chain.