
|
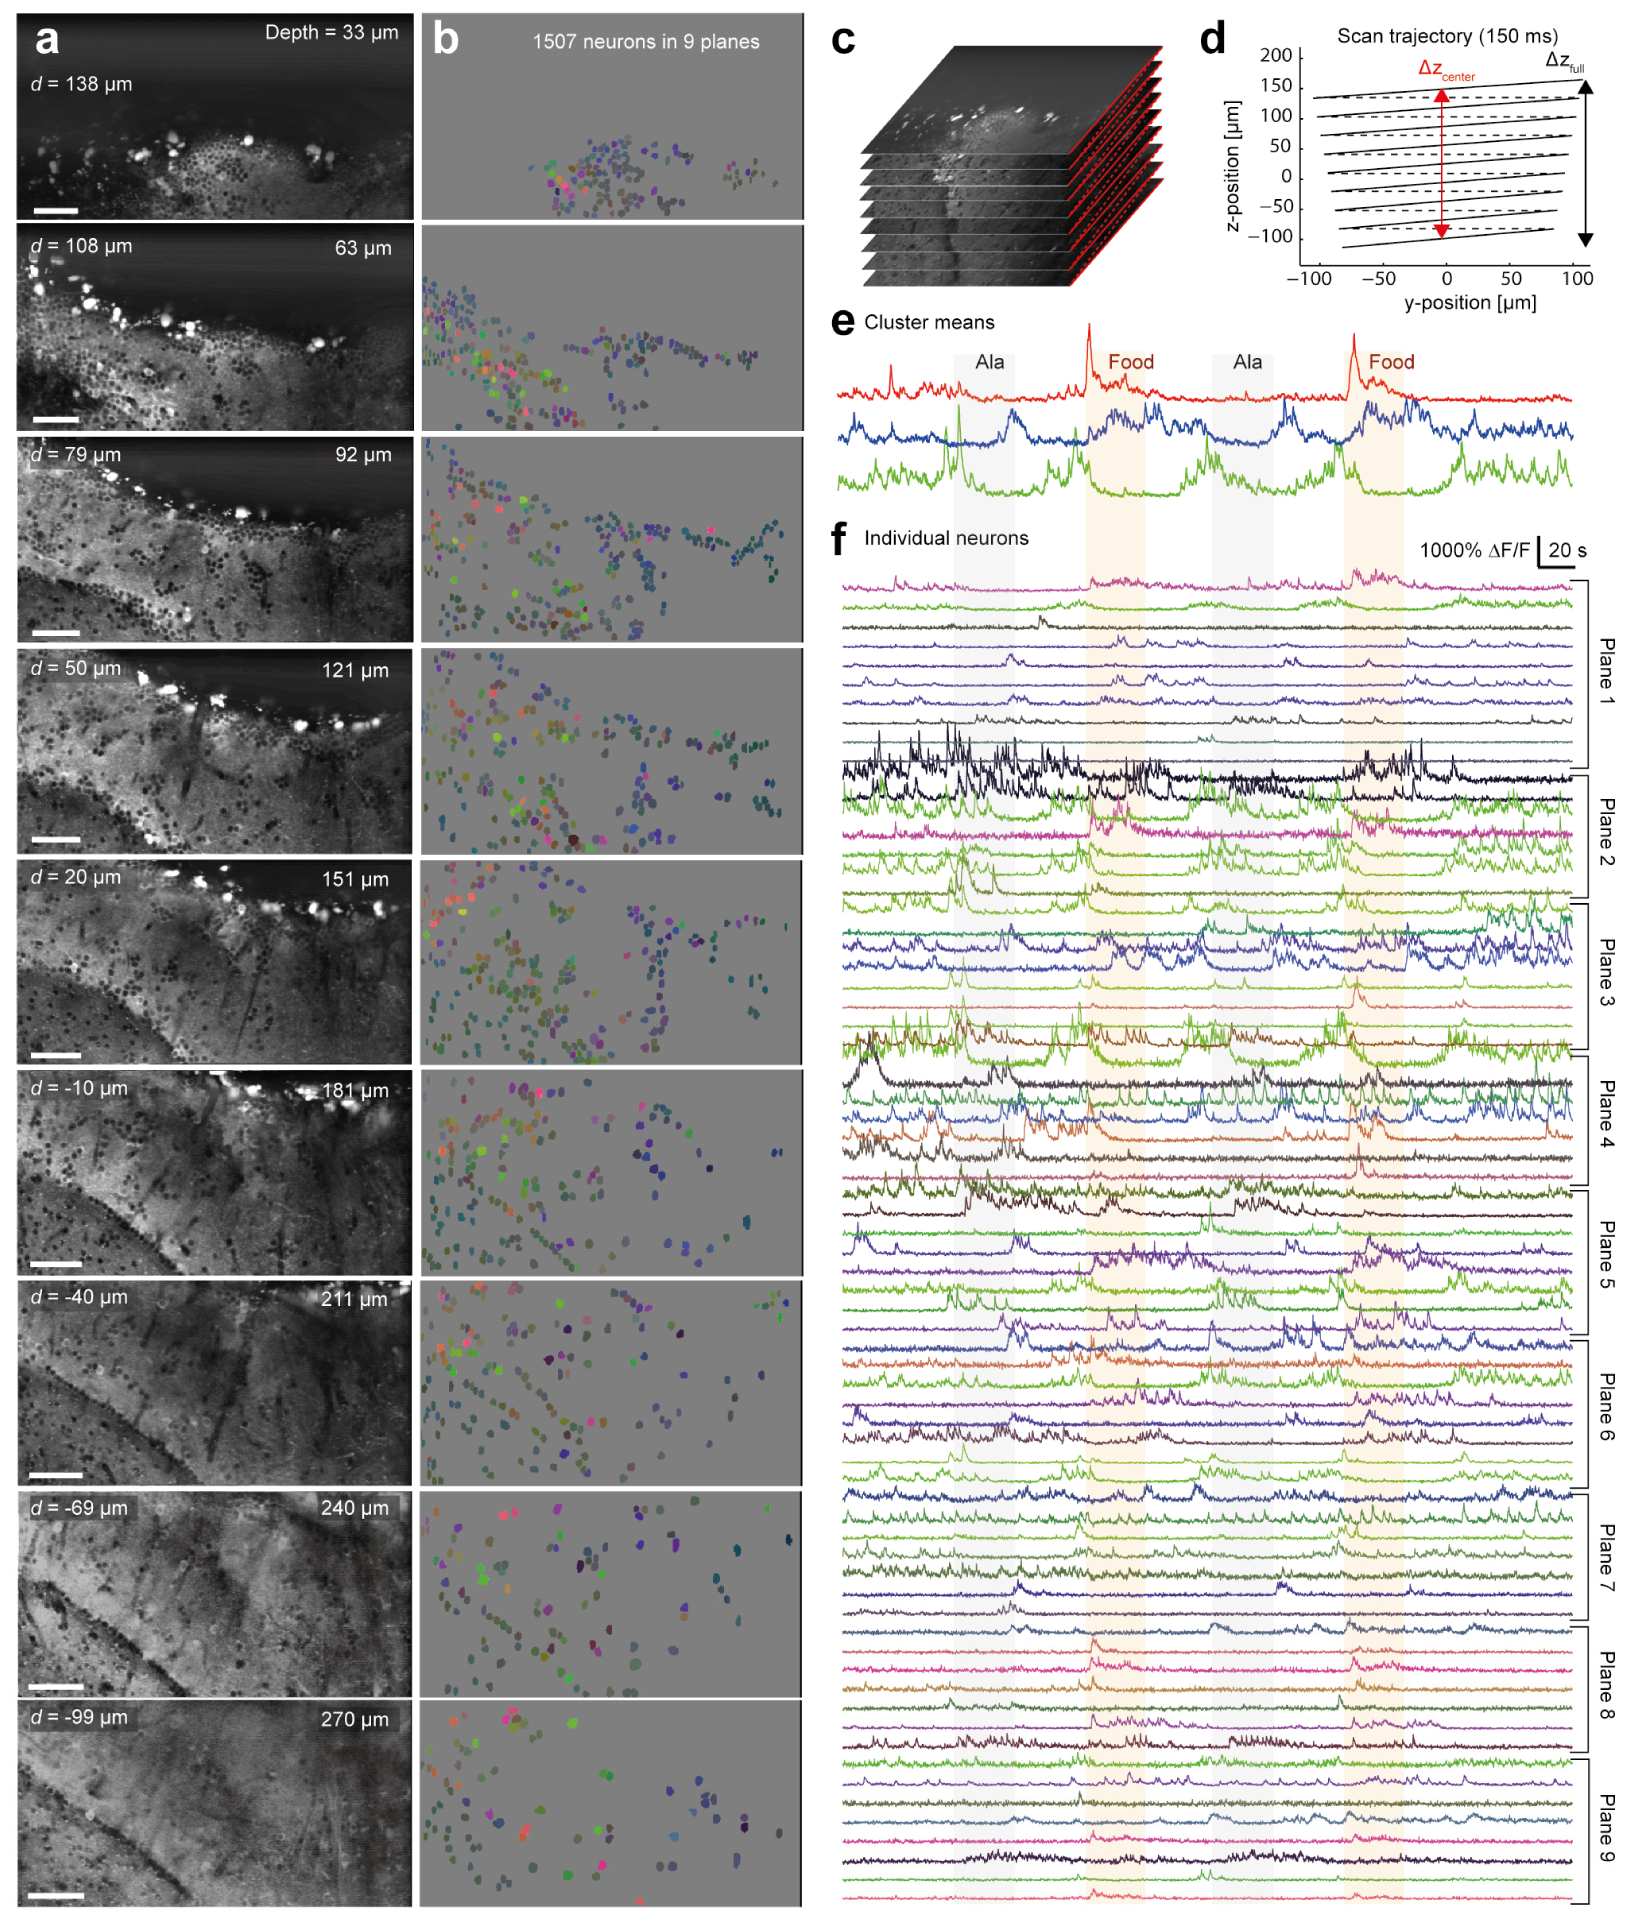
Fig. 6
Calcium imaging in Dp using configuration 2. (a) Fluorescence in each plane, averaged over the full duration of 400 s (see Visualization 2). d indicates the focal shift d(D), ‘depth’ the axial distance of the plane from the brain surface. All scale bars are 50 µp;m. (b) ROIs depicting clearly identified somata of 1507 neurons. Colors encode the correlation between the fluorescence time courses of each ROI and the first three clusters (e) in RGB (see Fig. 5(e)). (c) Schematic depiction of scanned planes. (d) Scan trajectory in yz. Planes were tilted (angle, 9.5°) and lower planes were slightly smaller due to FOV compression. Dashed lines indicate flybacks of the y-scanner. (e) Time courses of fluorescence signals averaged over ROIs of the first three activity clusters. Color corresponds to the RGB code in (b) and (f). Shading depicts periods of odor application. (f) Fluorescence time courses of subsets of ROIs from each plane. RGB color code shows correlation to the time course of each cluster (e).