
Image
|
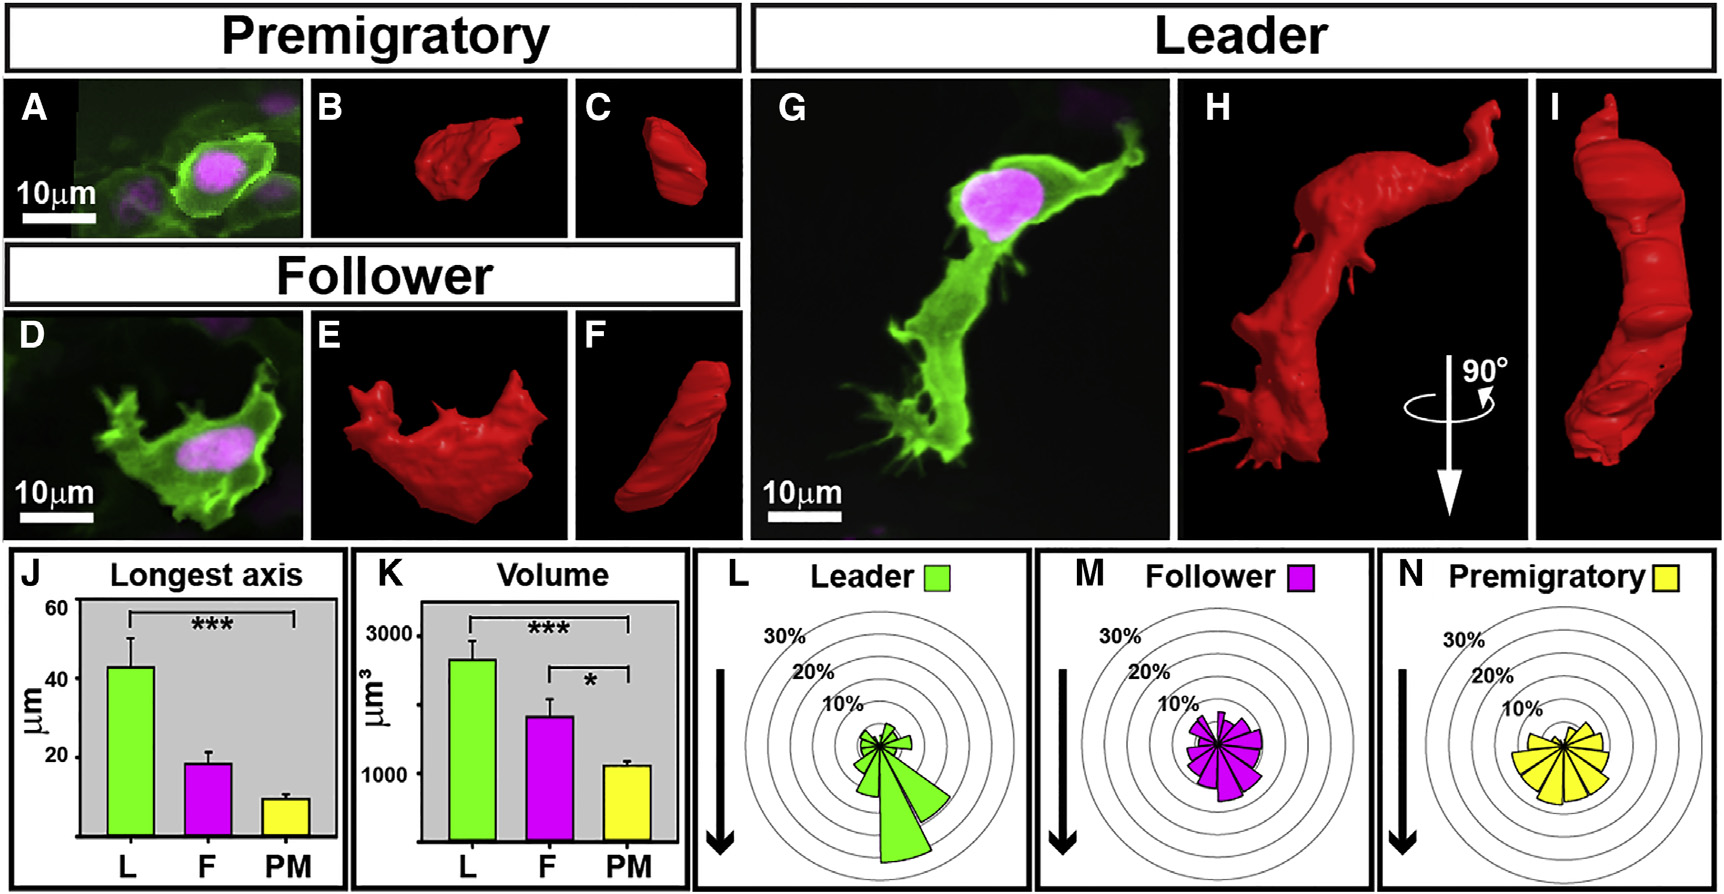
Figure Caption
Fig. 5
TNC Cells Show Different Morphology
(A-I) 3D models of PM (A-C), F (D-F), and L (G-I) cells. Picture of the modeled cell (A-I), lateral (B, E, and H), and 90° rotation (C, F, and I) of the 3D model.
(J and K) Mean longest axes and (K) mean volumes of L (n = 7), F (n = 10), and PM (n = 9), error bars represent SEM.
(L-N) Angle of protrusions of L (n = 12, 217 protrusion), F (n = 24, 308 protrusion), and PM (n = 9, 141 protrusions) cells. The arrow shows the direction used to orient cells.
See also Movie S10.
Acknowledgments
This image is the copyrighted work of the attributed author or publisher, and
ZFIN has permission only to display this image to its users.
Additional permissions should be obtained from the applicable author or publisher of the image.
Full text @ Cell Rep.