
IMAGE
Fig. 4
- ID
- ZDB-IMAGE-160608-4
- Genes
- Publication
- Wang et al., 2016 - Knockdown of zebrafish Nanog increases proliferation of primordial germ cells during early embryonic development
- All Figures
- Figures for Wang et al., 2016
Image
|
Figure Caption
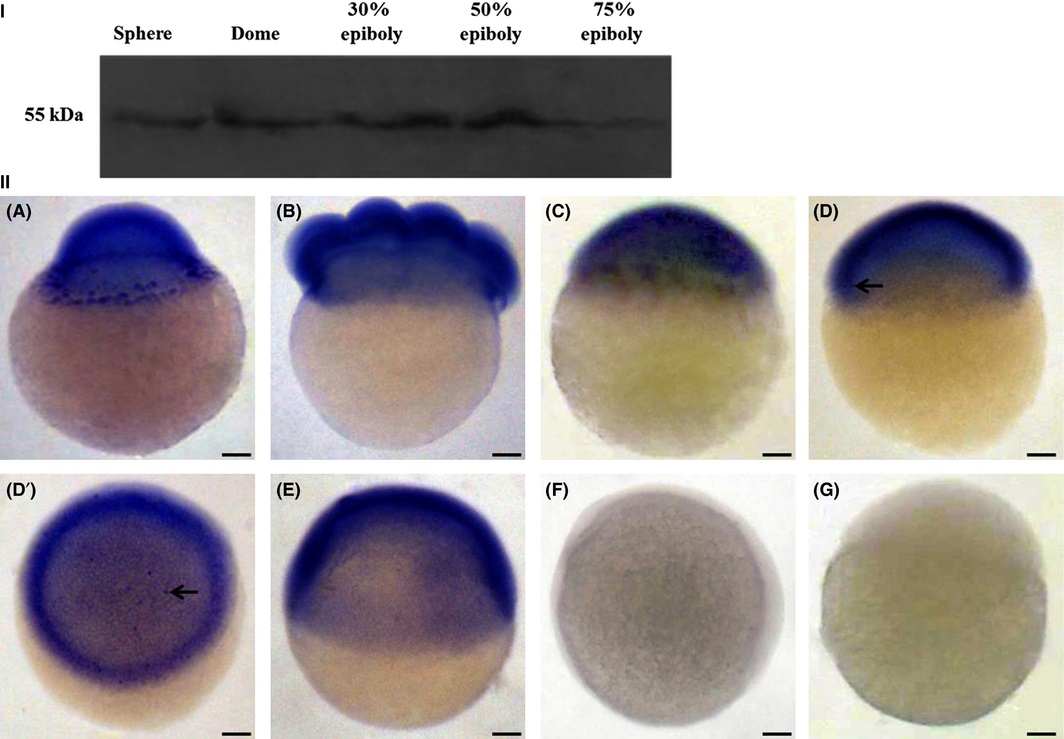
Fig. 4
The spatial distribution of zNanog mRNA during early embryogenesis. Whole-mount in situ hybridization was performed with zNanog anti-sense probes. A: 1-cell (lateral view), B: 8-cell (lateral view), C: 1000-cell (lateral view), D: 30% epiboly (lateral view), D′: 30% epiboly (top view), E: 50% epiboly (lateral view), F: 70% epiboly (lateral view), G: negative control of embryo of 1000-cell (other stages not shown).Scale bars: 0.5 mm in all panels.
Figure Data
Acknowledgments
This image is the copyrighted work of the attributed author or publisher, and
ZFIN has permission only to display this image to its users.
Additional permissions should be obtained from the applicable author or publisher of the image.
Full text @ Dev. Growth Diff.