
Fig. 3
- ID
- ZDB-IMAGE-160608-3
- Genes
- Antibodies
- Publication
- Wang et al., 2016 - Knockdown of zebrafish Nanog increases proliferation of primordial germ cells during early embryonic development
- All Figures
- Figures for Wang et al., 2016
|
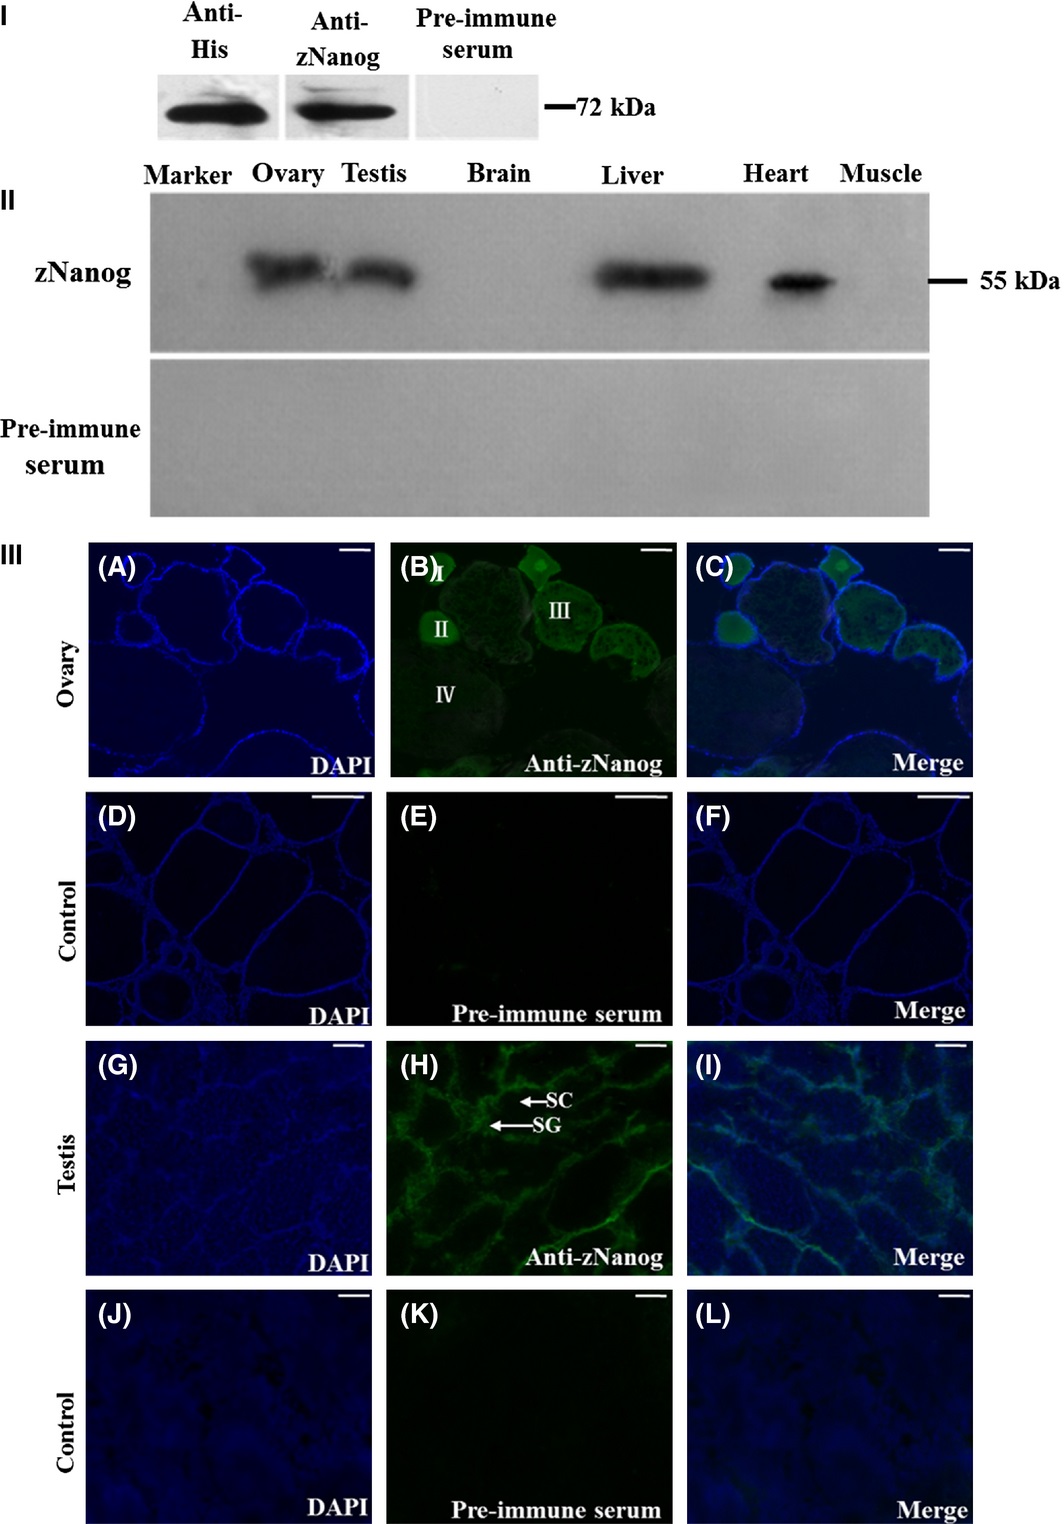
Fig. 3
The expression of zNanog in adult zebrafish tissues. (I) Western blot analysis of the His-tagged zNanog fusion protein probed with the anti-His antibody, anti-zNanog antibody or pre-immune serum, respectively. (II) Western blot analysis of zNanog in zebrafish tissues. The zNanog protein was expressed in the ovary, heart, testis, and liver, as detected by a single band of 55 kDa, but not in the muscle or brain. Pre-immune serum was used as a negative control. (III) The expression of zNanog in the zebrafish ovary and testis. The localization of zNanog in the ovary and testis cryosections was detected by immunofluorescence analysis (A-F: ovary; G-L: testis). A, D, G, and J: DAPI staining; B and H: zNanog polyclonal antibody and the secondary green fluorescent antibody; E and K: pre-immune serum and the secondary green fluorescent antibody; C, F, I, and L: Merge. I: stage I oocyte, II: stage II oocyte, III: stage III oocyte, IV: stage IV oocyte, SG: spermatogonia, SC: spermatocytes. Scale bars: 0.5 mm in all panels.