
Fig. 2
- ID
- ZDB-IMAGE-160608-2
- Genes
- Publication
- Wang et al., 2016 - Knockdown of zebrafish Nanog increases proliferation of primordial germ cells during early embryonic development
- All Figures
- Figures for Wang et al., 2016
|
Fig. 2
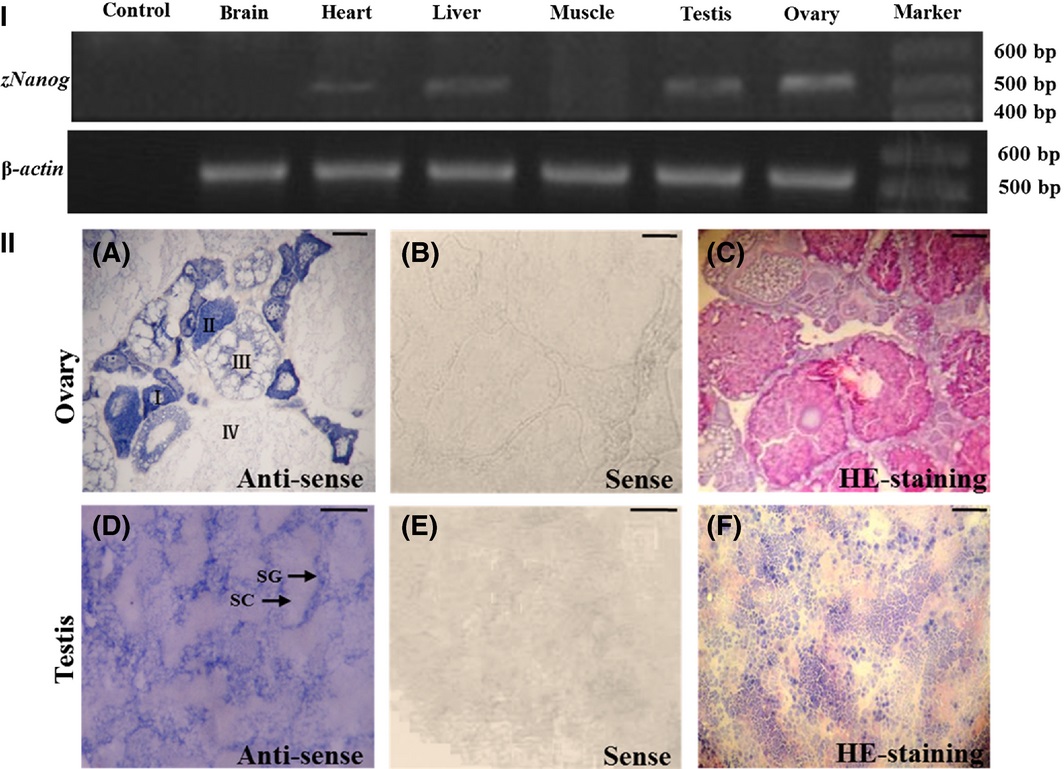
The expression of zNanog mRNA in adult zebrafish tissues. (I) The expression analysis of zNanog mRNA in various tissues using reverse transcription-polymerase chain reaction (RT-PCR) analysis. RNA template and β-actin were used as negative and internal controls, respectively. The zNanog mRNA was expressed in the ovary, testis, heart, and liver, but not in the muscle or brain. (II) The expression analysis of zNanog mRNA via in situ hybridization of ovary and testis cryosections. (A) zNanog mRNA was detected from stage I to II oocytes and was diminished in stage III oocytes, but was not observed in stage IV oocytes. (D) The expression of zNanog mRNA was detected mainly in the periphery of the seminiferous lobules in testis. (B and E) Sense probe. (C and F) HE staining. I: stage I oocyte, II: stage II oocyte, III: stage III oocyte, IV: stage IV oocyte, SG: spermatogonia, SC: spermatocytes. Scale bars: 0.5 mm in all panels.