
|
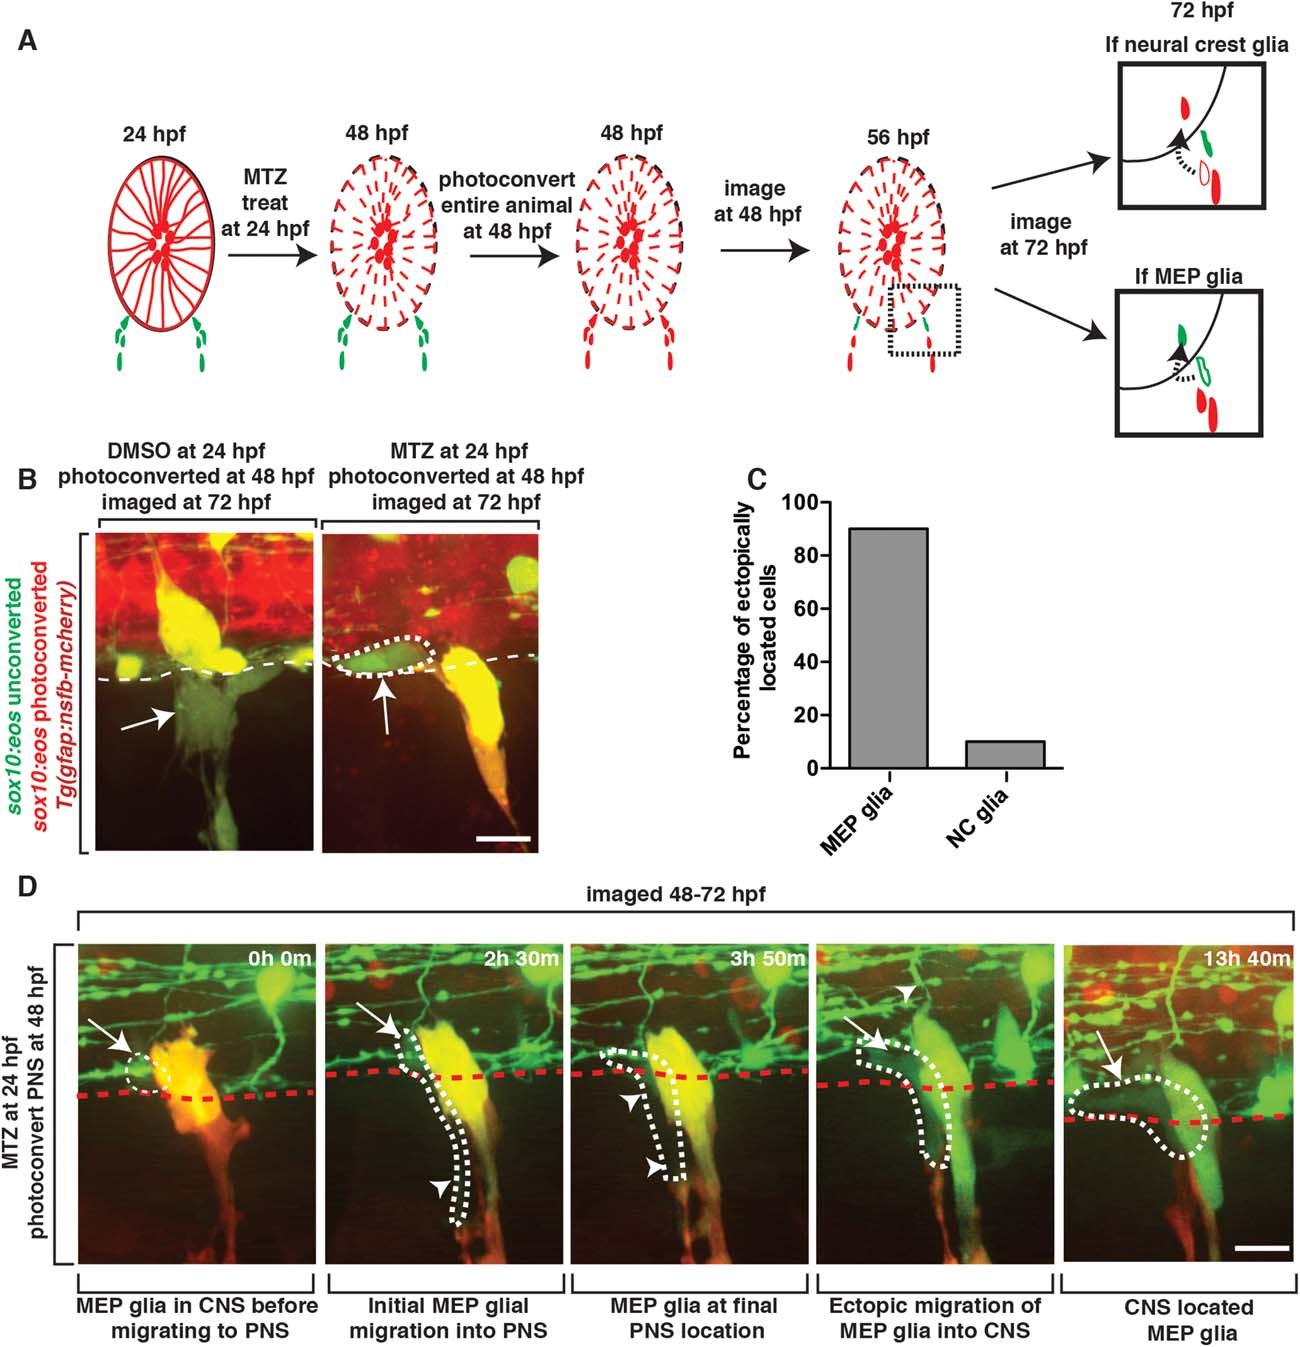
Fig. 6
MEP glia migrate into the spinal cord after radial glial ablation. A: Schematic of the use of Eos photoconversion to differentially label MEP glia vs neural crest-derived cells. Both potential outcomes are shown at 72 hpf. Arrow denotes migration path of a PNS cell (outlined cell) that has ectopically entered the spinal cord (solid cells). Red cells denote neural crest-derived cells while green cells denote MEP glia. B: Images of a Tg(sox10:eos);Tg(gfap:nsfB-mcherry) embryo that was treated at 24 hpf with MTZ, photoconverted at 48 hpf and then imaged at 72 hpf. Dotted circle denotes ectopically located sox10+ cell that is unconverted. C: Quantification of experiment described in A and shown in B. D: Images taken from a 24 hour time-lapse of a Tg(sox10:eos) embryo, imaged from 48 to 72 hpf, showing an unconverted Eos+ cell migrating out of the spinal cord and then back in. Dotted circle marks the cell that ectopically re-enters the spinal cord. Arrow marks the part of the cell that is in the CNS while arrowheads marks the PNS-located side of the cell. Scale bars, 25 µm.