
Image
|
Figure Caption
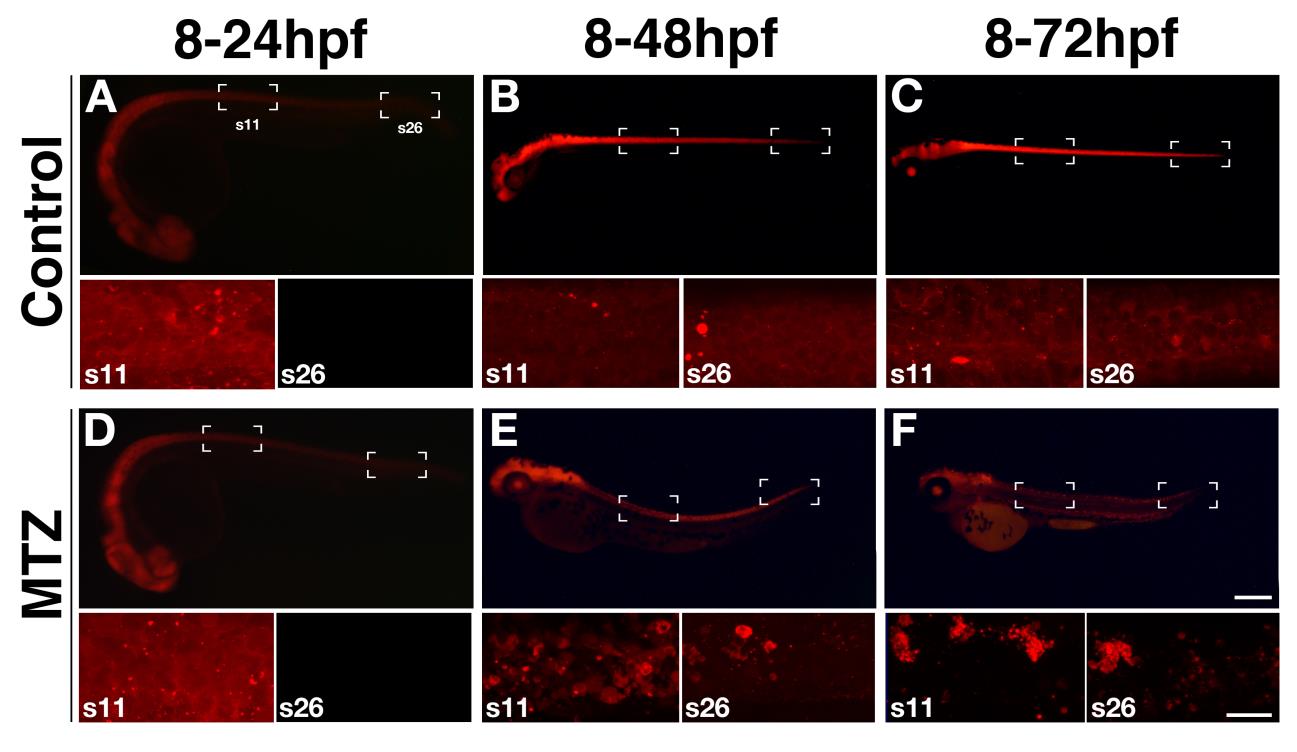
Fig. S4
Metronidazole (Mtz) treatment induces dynamic changes in mCherry expression.(A-F) Fluorescent images of live gfap:nfs-mCherrysc059 embryos following treatment with vehicle control (A-C) or Mtz (D-F). Higher magnification views of mCherry expression in the anterior (Somite 11) and posterior (somite 26) spinal cord. Scale bar in F = 100µm, scale bar in insets = 20µm.
Acknowledgments
This image is the copyrighted work of the attributed author or publisher, and
ZFIN has permission only to display this image to its users.
Additional permissions should be obtained from the applicable author or publisher of the image.
Full text @ Glia