
|
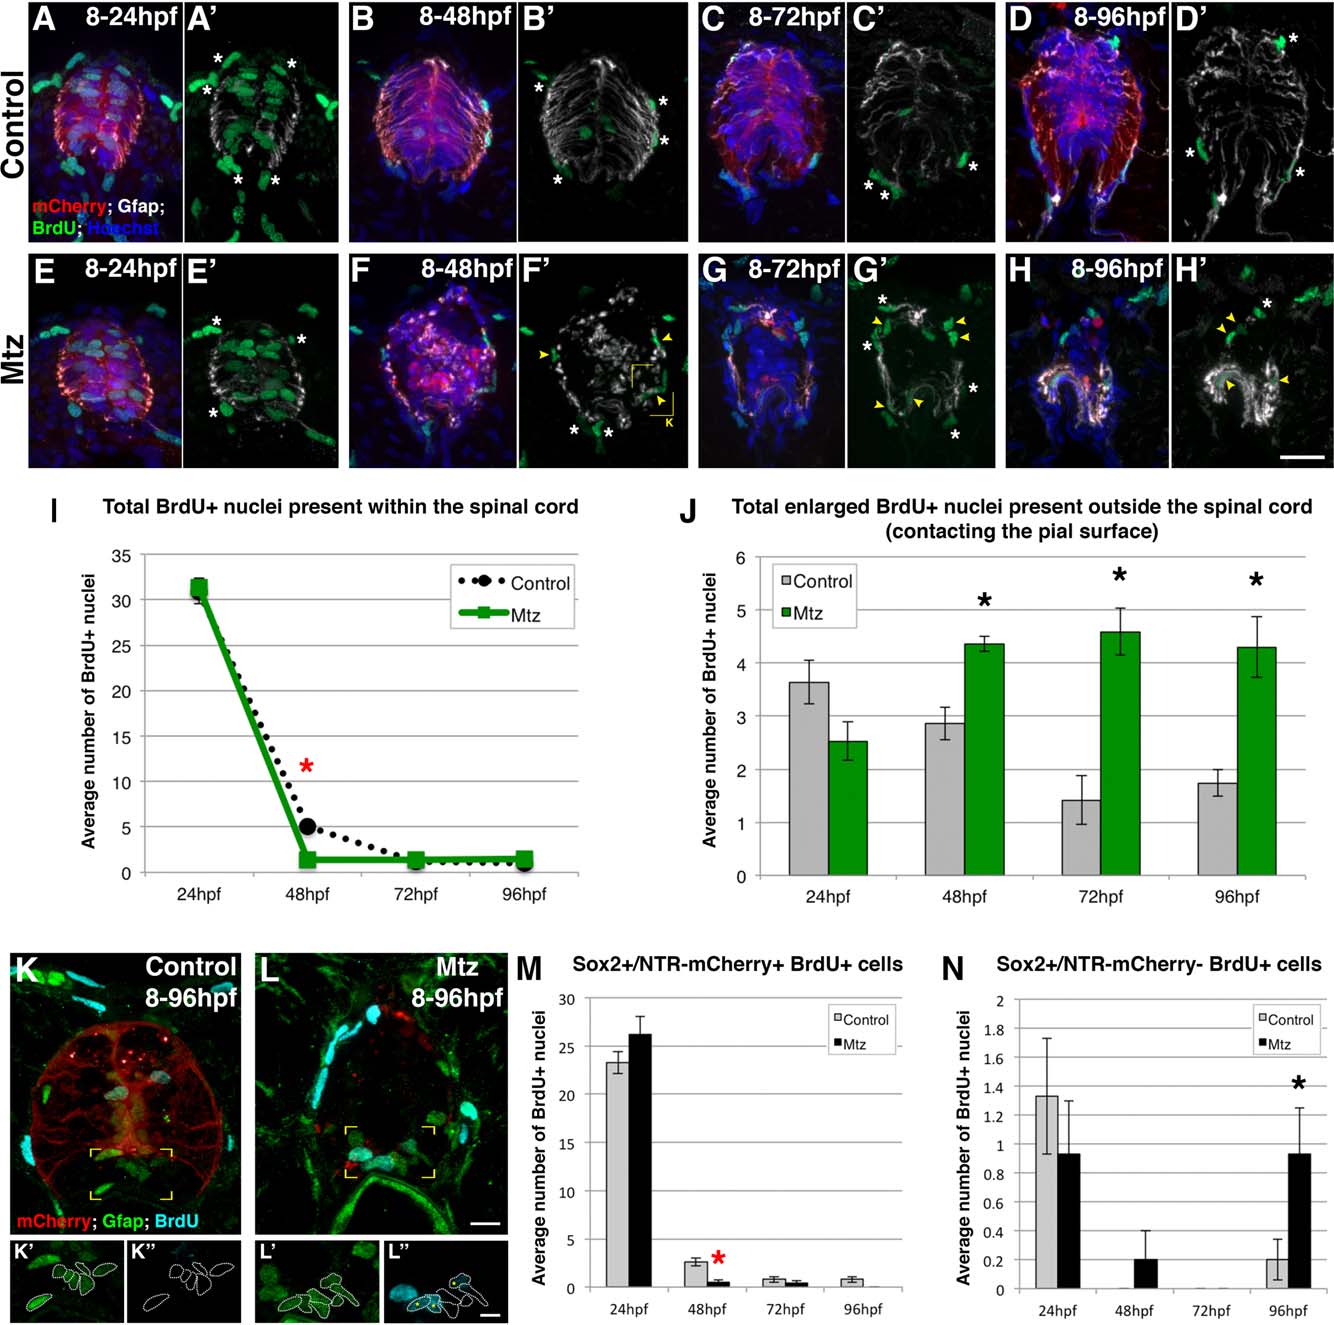
Fig. 7
Radial glial ablation and its effect on cell proliferation. (A-H′) Cross section views of proliferative cells within spinal cords of (A-D′) vehicle control and (E-H′) Mtz-treated embryos throughout neurogenesis visualized by immunolabeling with anti-BrdU (green), anti-Gfap (white), and Hoechst nuclear dye (blue). (A′-H′) represent the same images in (A-H) but only showing anti-Gfap and anti-BrdU labeling. BrdU+ nuclei outside of the spinal cord (white asterisks) or straddling the border (yellow arrowheads) are denoted. Scale bar = 10 µm. (I) Quantification of all BrdU+ populations visualized within the spinal cords between control (black line) and Mtz (green line) treatment groups. (J) Quantification of all elongated BrdU+ populations found outside of the spinal cord between vehicle control (gray) and Mtz (green) treatment groups. (K, L) Cross section views of (K) control and (L) Mtz-treated embryos immunolabeled for BrdU (cyan) and Sox2 (green) at 96 hpf. Scale bar = 10 µm. (K′-L3) Enlarged view of ventral Sox2+/NTR-mCherry negative cells (outlined) to denote cycling cells within this population (yellow asterisk). Scale bar = 5 µm. (M, N) Quantification of the two cycling Sox2+ populations present in the spinal cord following ablation. In all graphs, control averages are depicted in gray and Mtz averages are in black. Significant increases are depicted as black asterisks, and significant decreases are depicted as red asterisks.