
|
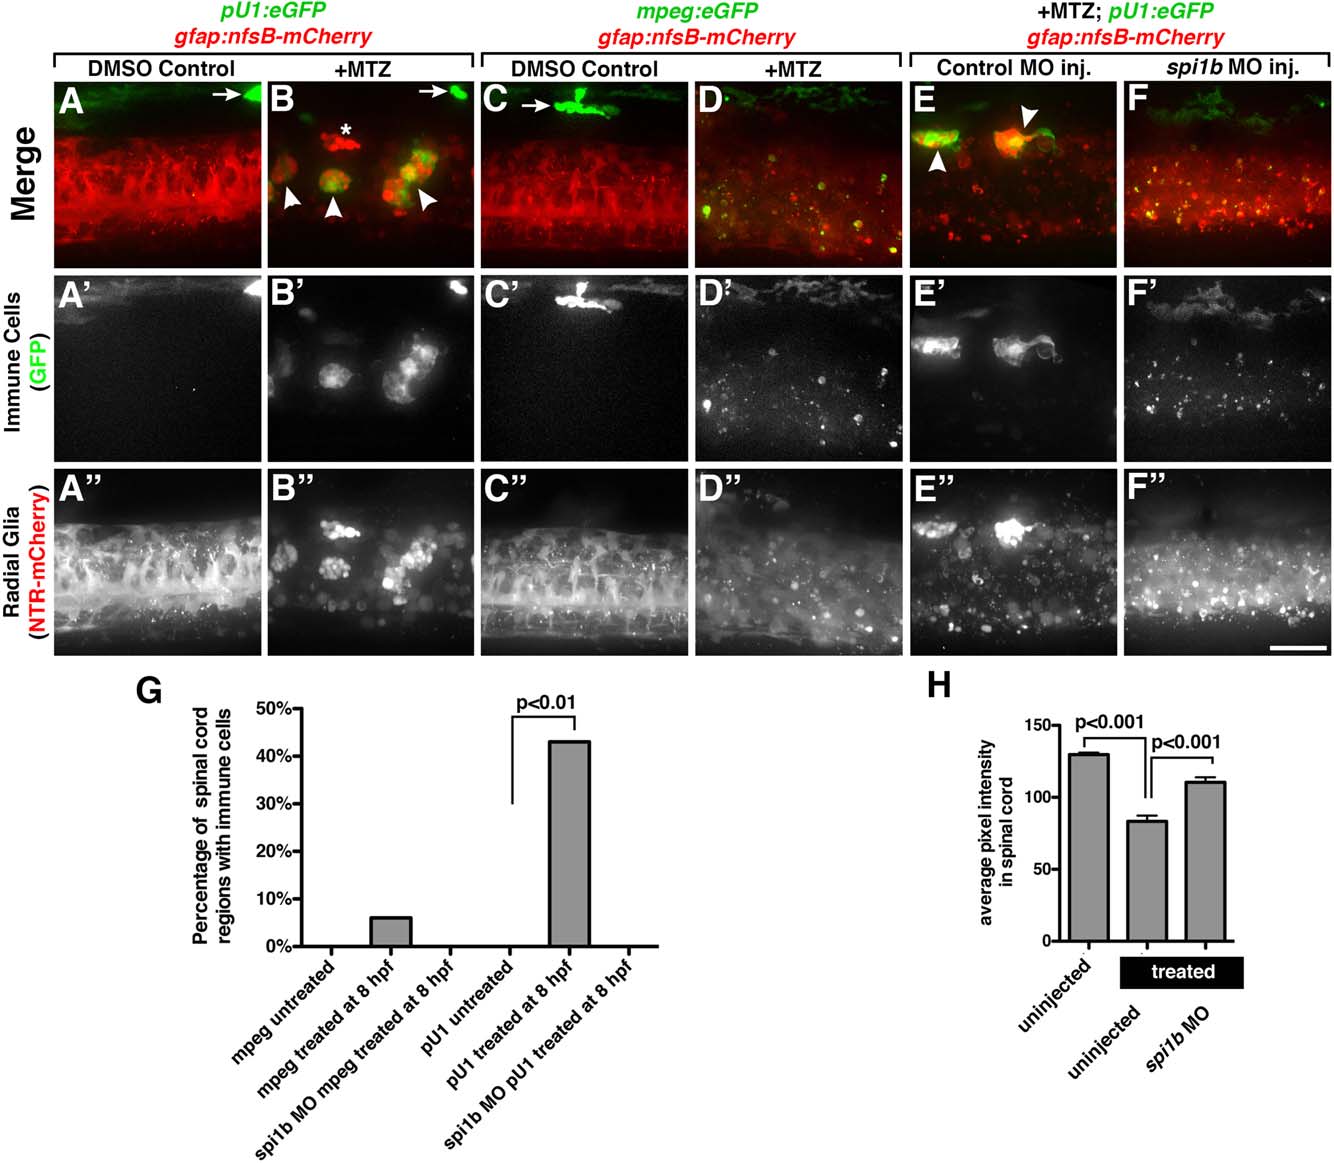
Fig. 5
Spinal cord radial glial debris is cleared by microglia. (A-B3) Lateral views of 72 hpf double transgenic gfap:nfsb-mCherrysc059;pU1:egfp embryos to depict macrophages (arrows) and microglia (arrowheads). (C-D3) Lateral views of 72 hpf double transgenic gfap:nfsb-mCherrysc059;mpeg:eGFP embryo showing the presence of macrophages. (E-F3) Lateral views of a 72 hpf gfap:nfsb-mCherrysc059;pU1:eGFP embryo injected with control or spi1b morpholino (spi1b MO). (G) Quantification depicting percent of the total spinal cord with immune cells present in control (untreated) and Mtz (treated) embryos expressing either the mpeg or pU1 promoter and injected with spi1b MO. (H) Quantification of the levels of NTR-mCherry+ expression through average pixel intensity in control embryos and embryos treated in Mtz that were either uninjected or injected with spi1b MO. Scale bar = 20µm.