
|
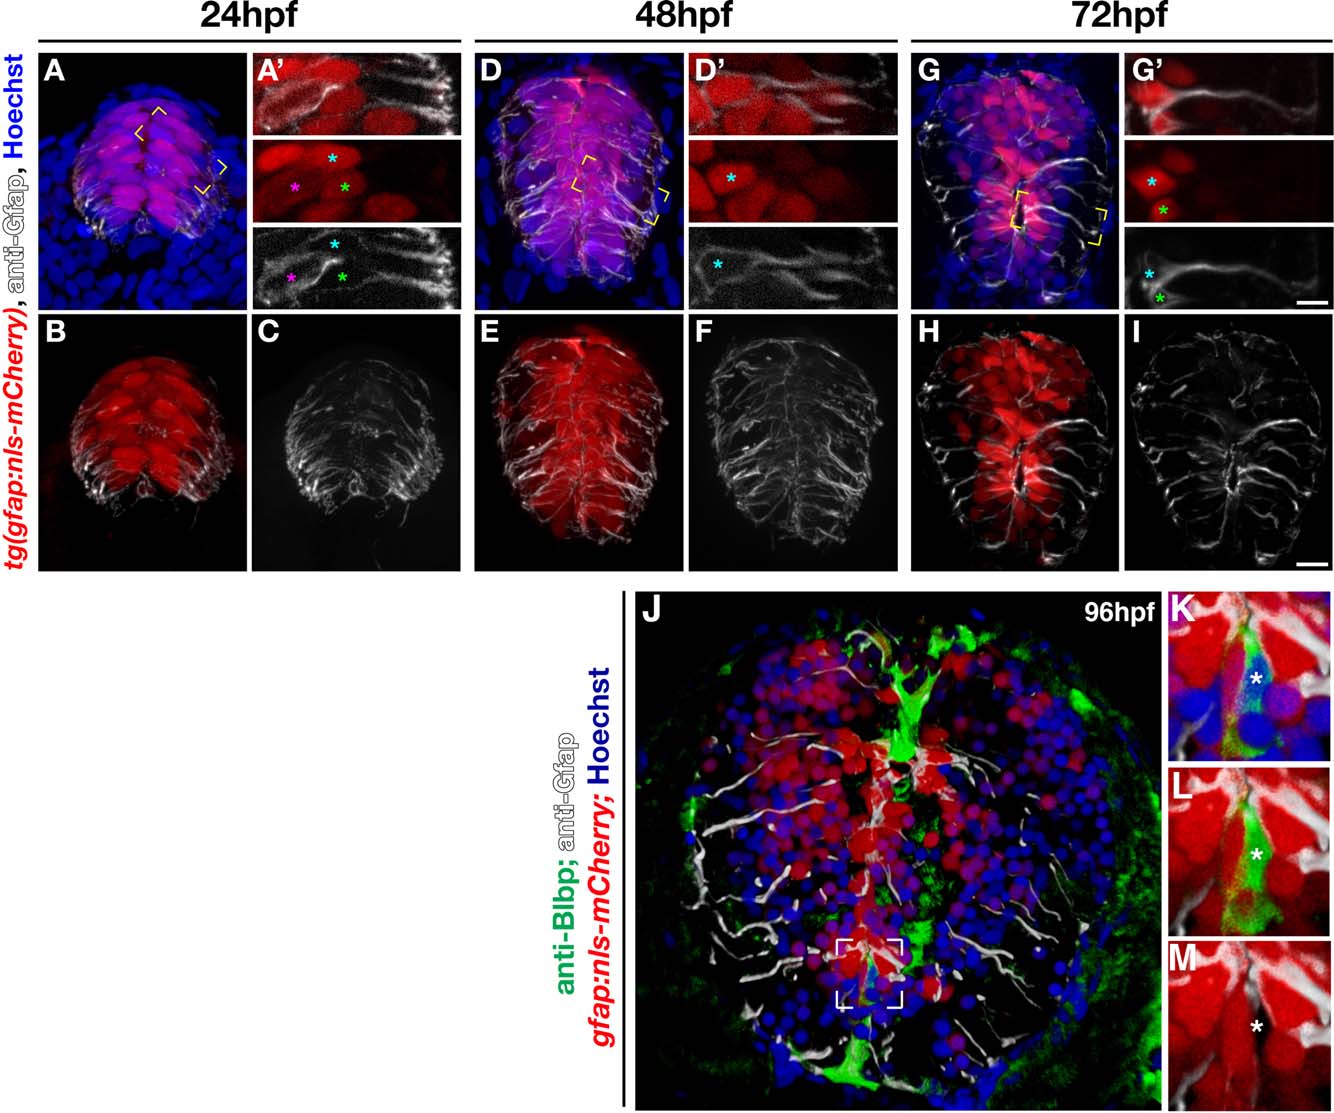
Fig. 1
The gfap:nls-mCherry transgene labels radial glial nuclei. (A-I) Maximum intensity projections showing cross sections of 24, 48, and 72 hpf gfap:nls-mCherry embryos, immunolabeled with anti-Gfap (white) for radial glia and Hoechst (blue) for nuclei. (A′, D′, G′) Magnified, single optical slices of individual cells in the yellow boxed area in A, D, G. Colored asterisks match nucleus with radial body. (J) Transverse section of a 96 hpf spinal cord from a gfap:nls-mCherry embryo colabeled for anti-Blbp (green), anti-Gfap (white), and nuclei (Hoechst, blue). (K-M) Higher magnification of boxed area in K with separated fluorescent channels (K, all channels; L, mCherry, Gfap, Blbp; M, mCherry and Gfap). Scale bar in G = 5 µm; scale bar in I = 10 µm.