
|
Fig. 7
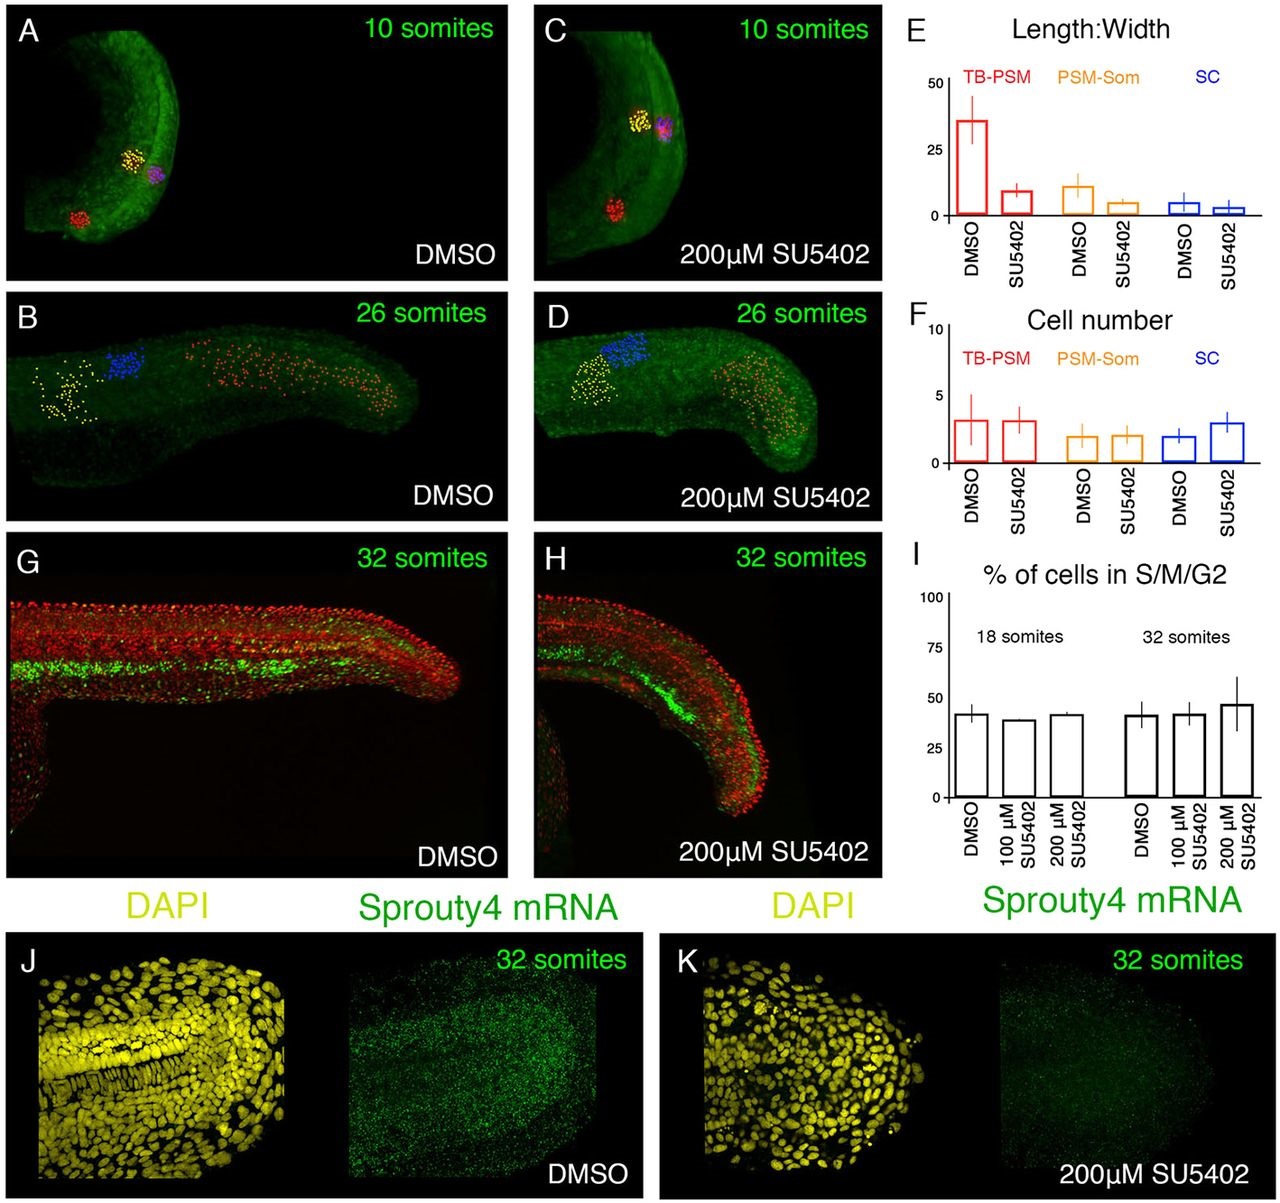
FGF signalling is required for cell movements but not cell proliferation. (A-D) Embryos previously injected with nls-KikGR mRNA were incubated in either 500µM DMSO (A,B) or 200µM SU5402 (C,D). Colours indicate cells in the PSM (yellow), tailbud (red) and spinal cord (blue). (E,F) Photolabels in tailbud (TB-PSM; red), PSM (PSM-Som; yellow) or spinal cord (SC; blue) were measured to display mean length:width ratio (E) and cell number (F). Error bars indicate s.d. (G,H). zFUCCI green embryos injected with nuclear mCherry mRNA and incubated in either 500µM DMSO (G) or 200µM SU5402 (H) from the ten- to the 32-somite stage. (I) Mean percentage of nuclei in S/M/G2 are plotted for each treatment group at the 18- and 31-somite stages. Error bars indicate s.d. Three to five embryos were analysed for each condition shown. (J,K) Fluorescent in situ hybridisations for the immediate FGF response gene sprouty4 (green), together with counter-staining for nuclei with DAPI (yellow) in the presence of 200µM SU5402 (K) or with DMSO only (J). Images are maximum projections of 20× 0.5683µm z-planes through the embryonic midline to determine FGF inhibition deep within the tissue of interest.