
|
Fig. 5
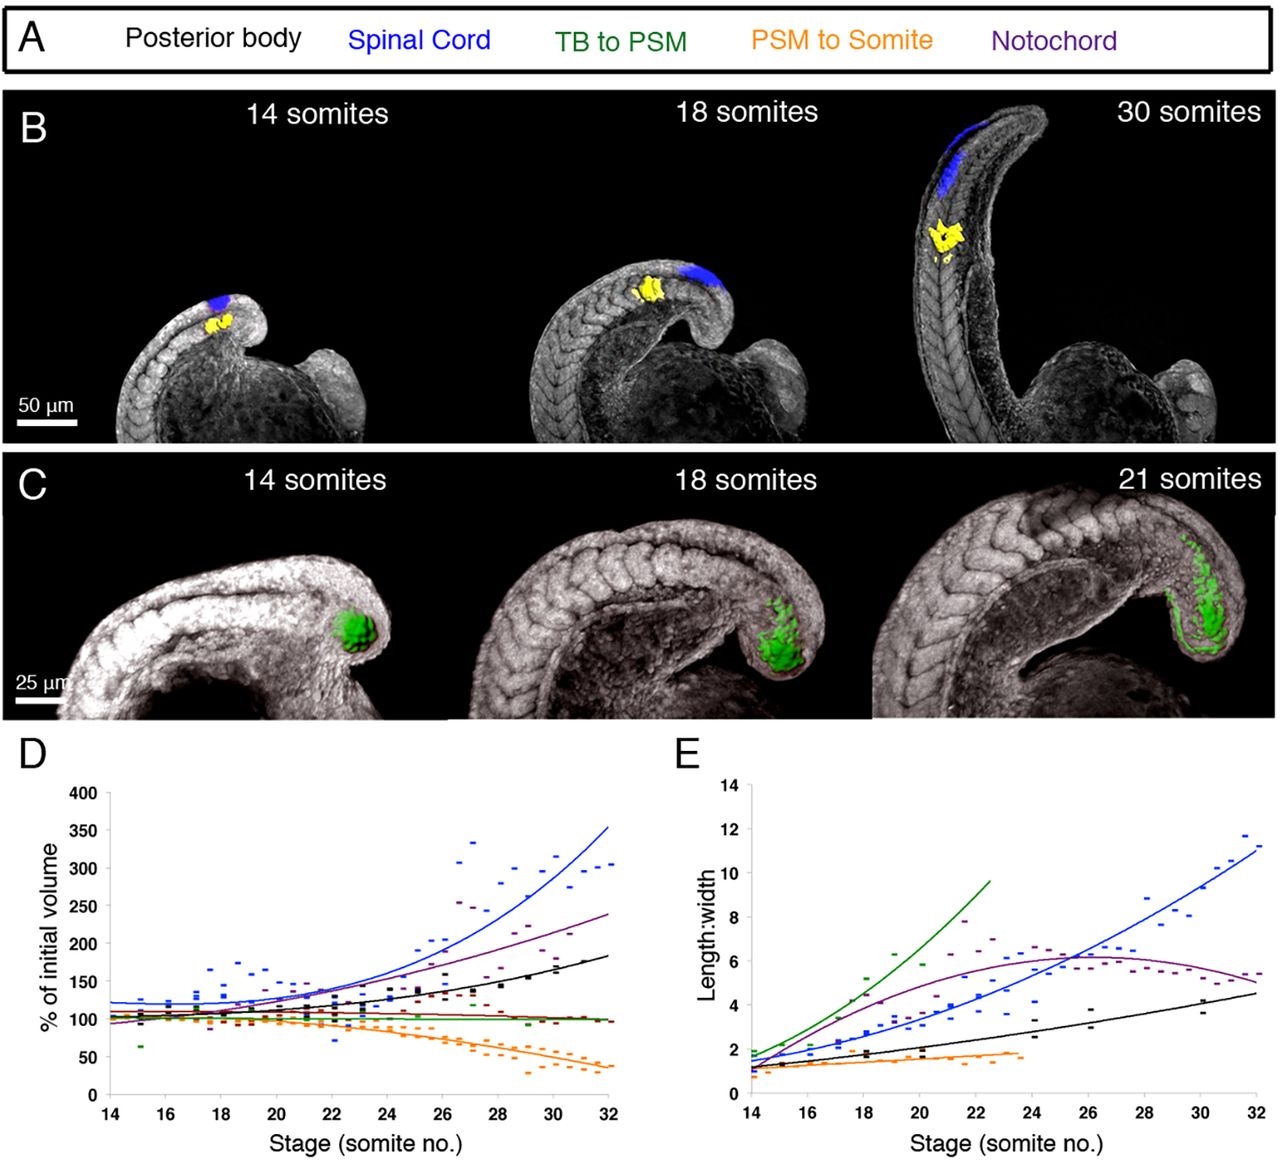
The spinal cord and notochord are the principal contributors to volumetric growth and the TB-to-PSM transiting cells to thinning and lengthening. (A) Different tissues are colour coded according to the key shown. (B,C) Stills from time-lapse movies of embryos injected at the one-cell stage with KikGR mRNA and photolabelled in the spinal cord and in the PSM (B) or in the tailbud (TB) (C) at the 14-somite stage. (D,E) Plots of volume fold increase (D; spinal cord, n=51, notochord; n=31; PSM to somites, n=58; TB to PSM, n=23) and length:width ratio (E; spinal cord, n=43; notochord, n=30; PSM to somites, n=17; TB to PSM, n=12) of each photolabelled region against time (number of somites). The red curve in D corresponds to the volume increase of the KikGR-labelled cytoplasm of notochord cells. Data points show individual measurements; n=total number of measurements from embryos from three experiments.