
|
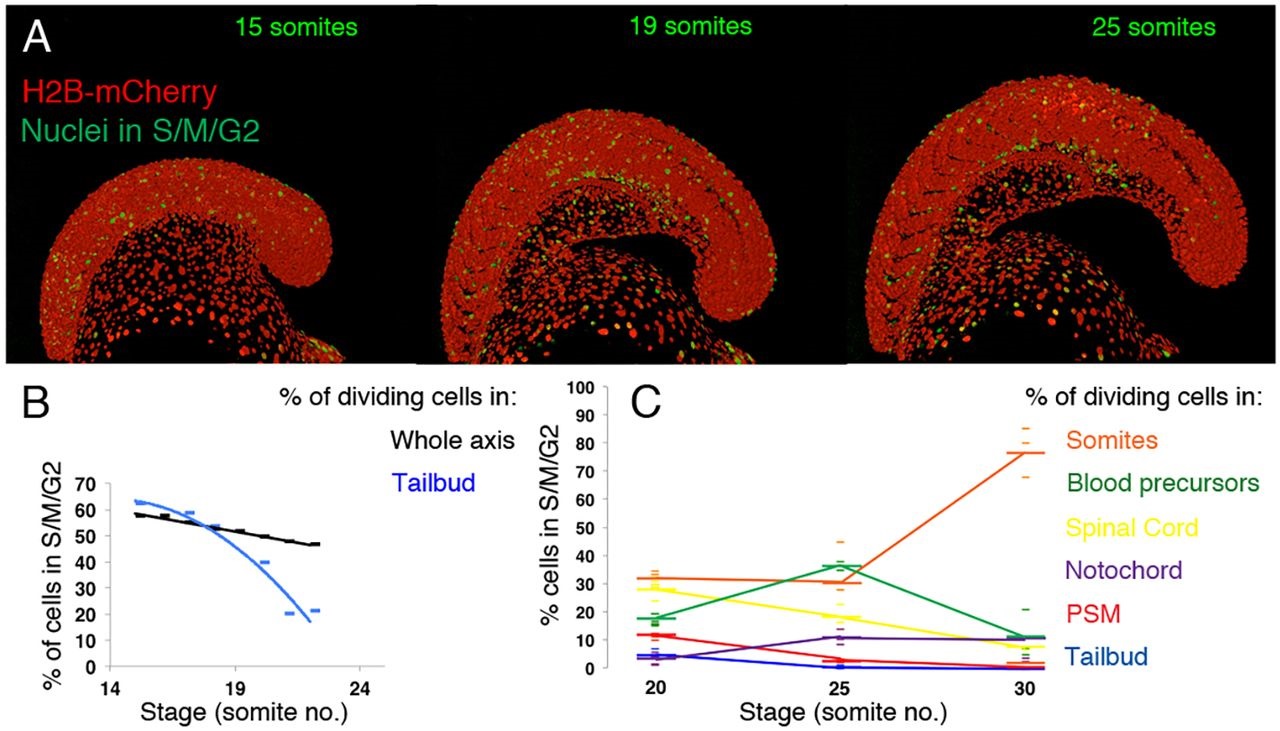
Fig. 4
Proliferation rapidly reaches a low level in the unsegmented region. (A) Stills from a time-lapse of zFUCCI green embryos injected with nuclear mCherry mRNA. (B) Plot of the percentage of nuclei in S/M/G2 (green in A) with respect to total nuclei (red in A) against time (number of somites), showing the posterior body as a whole (black line) and the tailbud (blue line). This trend was observed in three independent time-lapse movies. (C) Percentage of nuclei in S/M/G2 (green) with respect to total nuclei (red) in tailbud (blue), PSM (red), notochord (purple), spinal cord (yellow), blood precursors (green) and somites (orange) at 20-, 25- and 30-somite stages. Small dashes show counts from four embryos fixed at each stage, large dashes indicate mean value.