
|
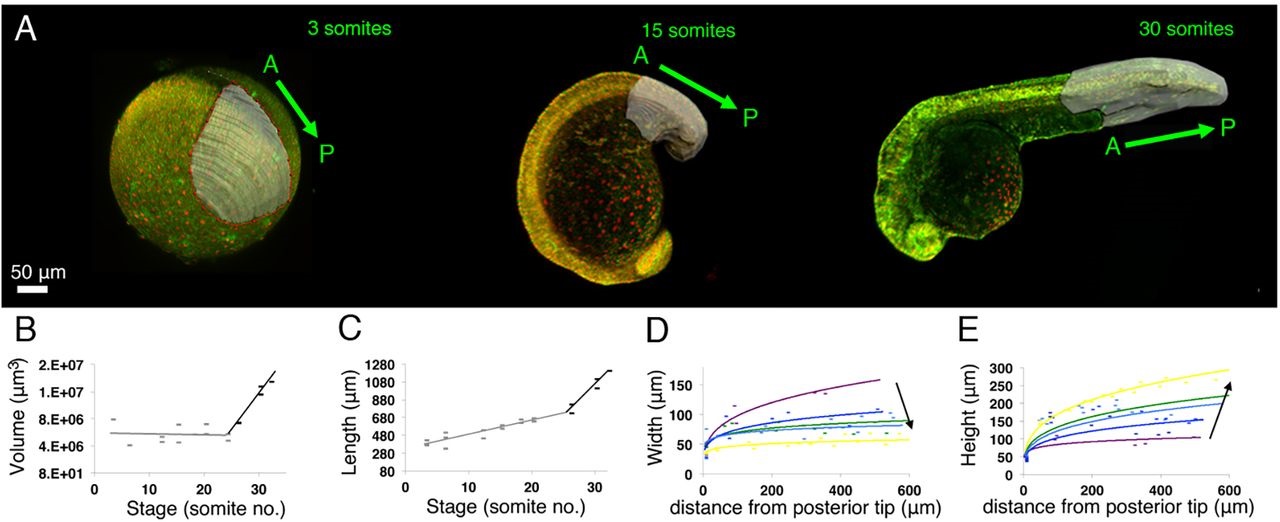
Fig. 2
Posterior body elongation in zebrafish occurs firstly in the absence of volumetric growth followed by a later volumetric growth phase. (A) Surface reconstructions (grey region) of the posterior body through posterior body elongation. Embryos previously injected with nuclear mCherry and membrane eGFP mRNAs in lateral view with A and P marking anterior and posterior poles. (B,C) Plots of volume (B; n=21) and length (C; n=21) against time (number of somites). Grey points/trendlines: three- to 24-somite stages. Black points/trendlines: 24- to 32-somite stages. (D,E) Width (D) and height (E) against distance from posterior tip of the tail to where each measurement was taken. Each curve corresponds to a developmental stage (number of somites). Colour code: purple, 12 somites (s) (n=5); dark blue, 15s (n=8); light blue, 18s (n=7); green, 20s (n=12); yellow, 24s (n=17). Data points show individual measurements; n=total number of measurements from three embryos per stage. Black arrows show direction of trend over time.