
|
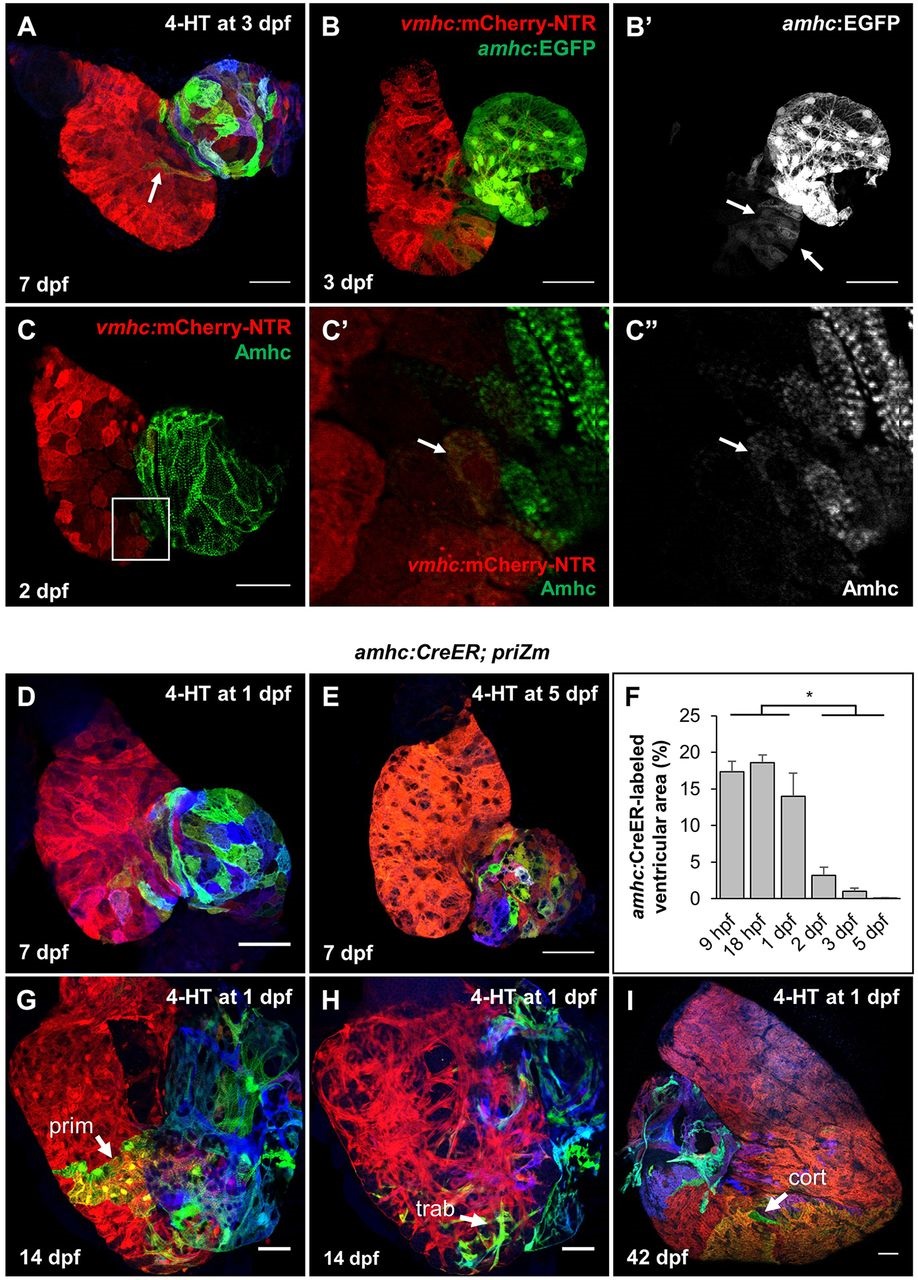
Fig. 4
Transiently amhc+ cardiomyocytes populate the ventricular apex. (A) Surface myocardium of a 7dpf heart from an amhc:CreER; priZm animal treated with 4-HT at 3dpf, displaying a non-red cardiomyocyte (white arrow) on the ventricular side of the AV junction (dashed line). (B) Surface myocardium of a 3dpf heart from a vmhc:mCherry-NTR and amhc:EGFP animal. (C) Surface myocardium of a 2dpf heart expressing vmhc:mCherry-NTR and immunostained for Amhc. Magnified region shows area of EGFP expression within the ventricle (V) near the AV junction (dashed line). Arrow indicates an Amhc+ cardiomyocyte in the ventricle. (D,E) Surface myocardium of 7dpf amhc:CreER; priZm hearts from animals treated with 4-HT at 1dpf or 5dpf, respectively. (F) Percentage of ventricular surface area labeled in 7dpf amhc:CreER; priZm hearts treated at 9hpf (n=7), 18hpf (n=8), 1dpf (n=7), 2dpf (n=7), 3dpf (n=8) or 5dpf (n=7) (means±s.e.m.). Asterisk indicates that the means are significantly heterogeneous (one-way ANOVA, P<0.05) and a significant difference exists between the indicated groupings (Tukey-Kramer test, P<0.05). (G,H) Surface and deep myocardium, respectively, of a 14dpf amhc:CreER; priZm heart treated with 4-HT at 1dpf. Cardiomyocytes of the primordial ventricular wall (prim) and trabecular muscle (trab) are indicated with an arrow. (I) Surface myocardium of a 42dpf amhc:CreER; priZm heart treated with 4-HT at 1dpf. A labeled region of the ventricular cortical myocardium (cort) is indicated with an arrow. Scale bars: 100µm in I; 50µm in A,B,D,E,G,H; 25µm in C-C′.