
|
Fig. 1
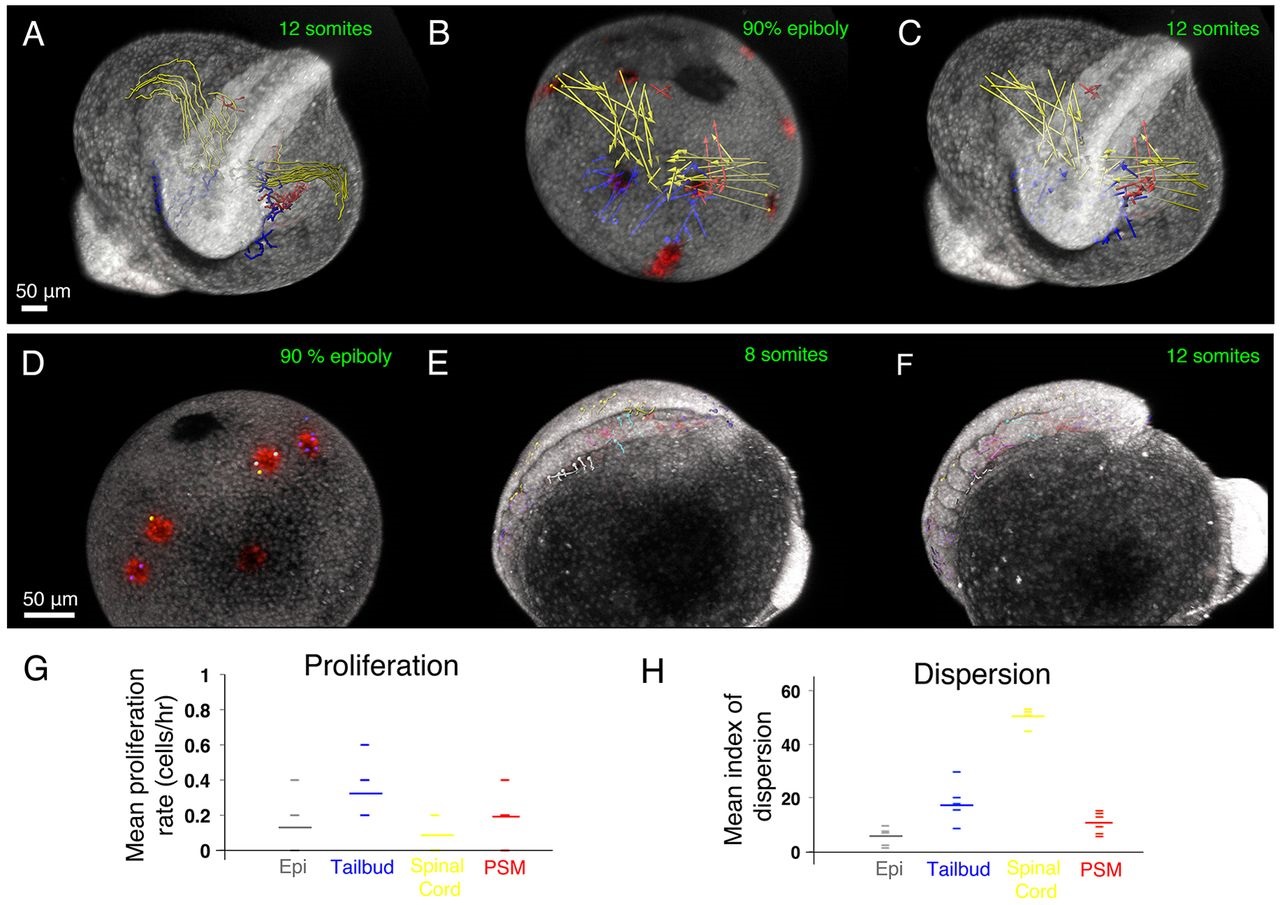
Convergence of lateral cells contributes to the elongating posterior body. (A-C) Tracks (A) and displacement vectors (B,C) of spinal cord (yellow), tailbud (blue) and PSM (red) precursors from automated tracking of photolabelled nuclei from the 90% epiboly to the 12-somite stage. (D-F) Tracks of cells from the 90% epiboly to the 12-somite stage. (G) Proliferation rate, expressed as the number of additional cells generated divided by the time interval (5h), within clones fated towards the epidermis (Epi; mean 0.13 cells/h, n=53), tailbud (mean 0.36 cells/h, n=53), spinal cord (mean 0.04 cells/h, n=85) and PSM (mean 0.2 cells/h, n=74). (H) Index of dispersion (mean increase in inter-nuclear distance between neighbouring cells) for cells fated towards the epidermis (Epi; mean 5.56µm, n=53), tailbud (mean 18µm, n=53), spinal cord (mean 50µm, n=85) and PSM (mean 11µm, n=74). Small dashes show values from five independent movies. Large dashes mark the mean.