
|
Fig. S2
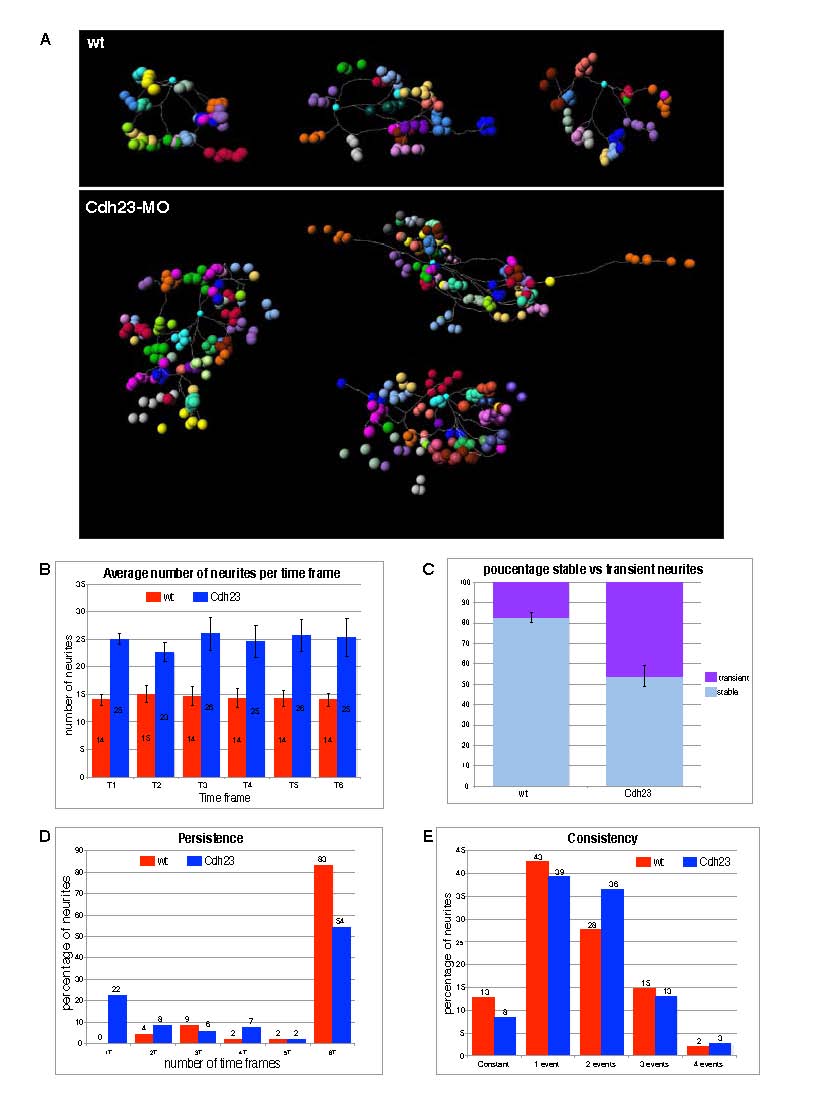
Four-dimensional representations of single labeled afferent neurons and quantitative analysis of neurite dynamics. (A) Four-dimensional representations of single labeled afferent neurons in three wild-type fish (above) and three Cdh23 morphants (below). Each neuron terminal point has been plotted with a different color. For each terminal point (i.e. for each color) positions have been plotted over time, every 10 minutes for 1 hour. (B-E) Quantitative analysis of neurite dynamics. (B) Average number of neurites present at each time point for wild-type fish and Cdh23 morphants. (C) Average of stable (present throughout the six time frames) versus transient (present in fewer than six time frames) neurites in wild-type fish and Cdh23 morphants. Error bars represent the s.e.m. (D) Neurite persistence. Persistence of the neurites was calculated by counting the percentage of neurites present for only one, two, three, four, five or all six time frames. (E) Neurite consistency. ′Consistent′ refers to a neurite that has neither grown nor retracted over the six time frames. ′One event′ refers to a neurite that has only grown or only retracted over the six time frames. ′Two events′ refers to a neurite that completed a sequence of two counter movements, i.e. growth followed by retraction or vice versa. Similarly, ′three events′ refers to a sequence of three counter movements; for example, growth followed by retraction followed by growth. Wild type, n=3; Cdh23, n=3.