
|
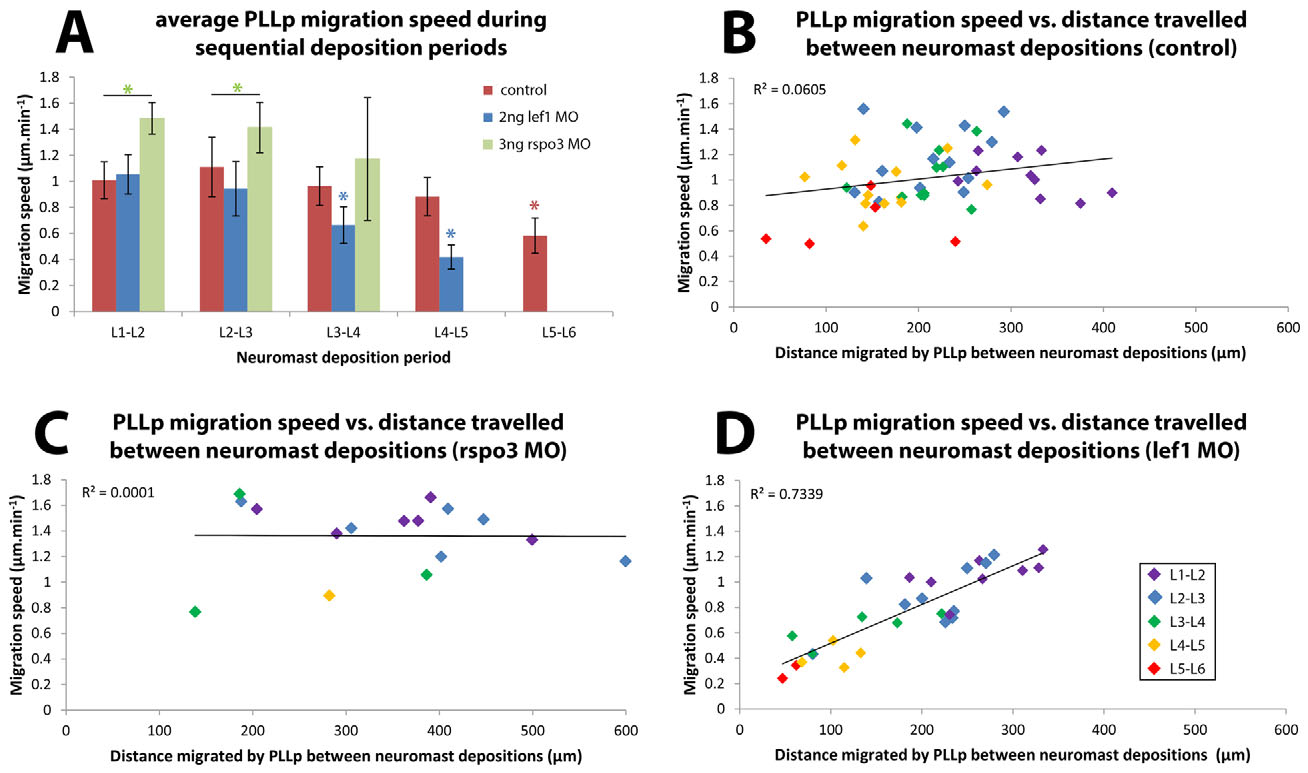
Fig. 3
Correlation of PLLp migration speed with spacing of deposited neuromasts. (A) PLLp migration speed compared in control, lef1 and rspo3 morphant embryos in successive periods between neuromast deposition. Red asterisk indicates that the speed between L5-L6 depositions was significantly slower than between preceding L4-L5 depositions. Blue asterisks indicate that PLLp speed in lef1 morphants between L3-L4 and L4-L5 depositions was significantly slower than in the respective, preceding deposition cycles. In addition, PLLp speed in lef1 morphants between L3-L4 and L4-L5 depositions was significantly slower than in controls during the same deposition cycle. Green asterisks indicate statistical significance between the indicated measurements (black bar). *P<0.05. Error bars indicate s.d. (B-D) PLLp migration speed plotted against distance traveled between neuromast depositions in wild-type (B), rspo3 morphant (C) and lef1 morphant (D) embryos. Points are shown in different colors for successive pairs of neuromasts (color key in D). Linear regression lines are shown for each data set. The associated coefficient of determination (R2) indicates that the correlation between PLLp migration speed and distance traveled between neuromast depositions is strong only for lef1 morphants. See Table S3 for additional information.