
|
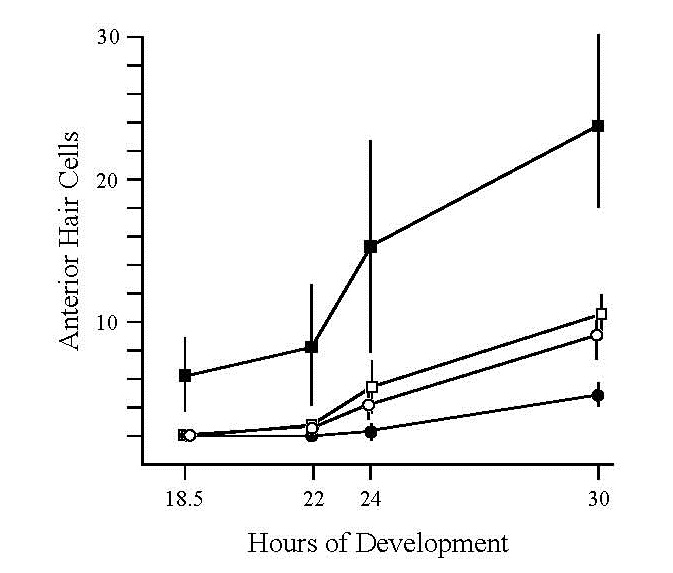
Fig. 5
Time course of hair cell formation in utricular maculae. Tether cells were visualized in live embryos at 18.5 and 21 h. At later stages of development, hair cells were visualized by fixing and staining embryos with anti-Pax2 and/or anti-acetylated tubulin antibodies. Utricular (anterior) maculae are easily visualized in live specimens and show faster rates of growth than saccular maculae in all genetic backgrounds. Each time point shows the mean and standard deviation of data pooled from three clutches of 10 or more embryos each. Symbols: (●) wild-type, (○) noitb21/tb21, (■) dlAdx2/dx2 and (□) dlAdx2/dx2; noitb21/tb21 embryos.