
|
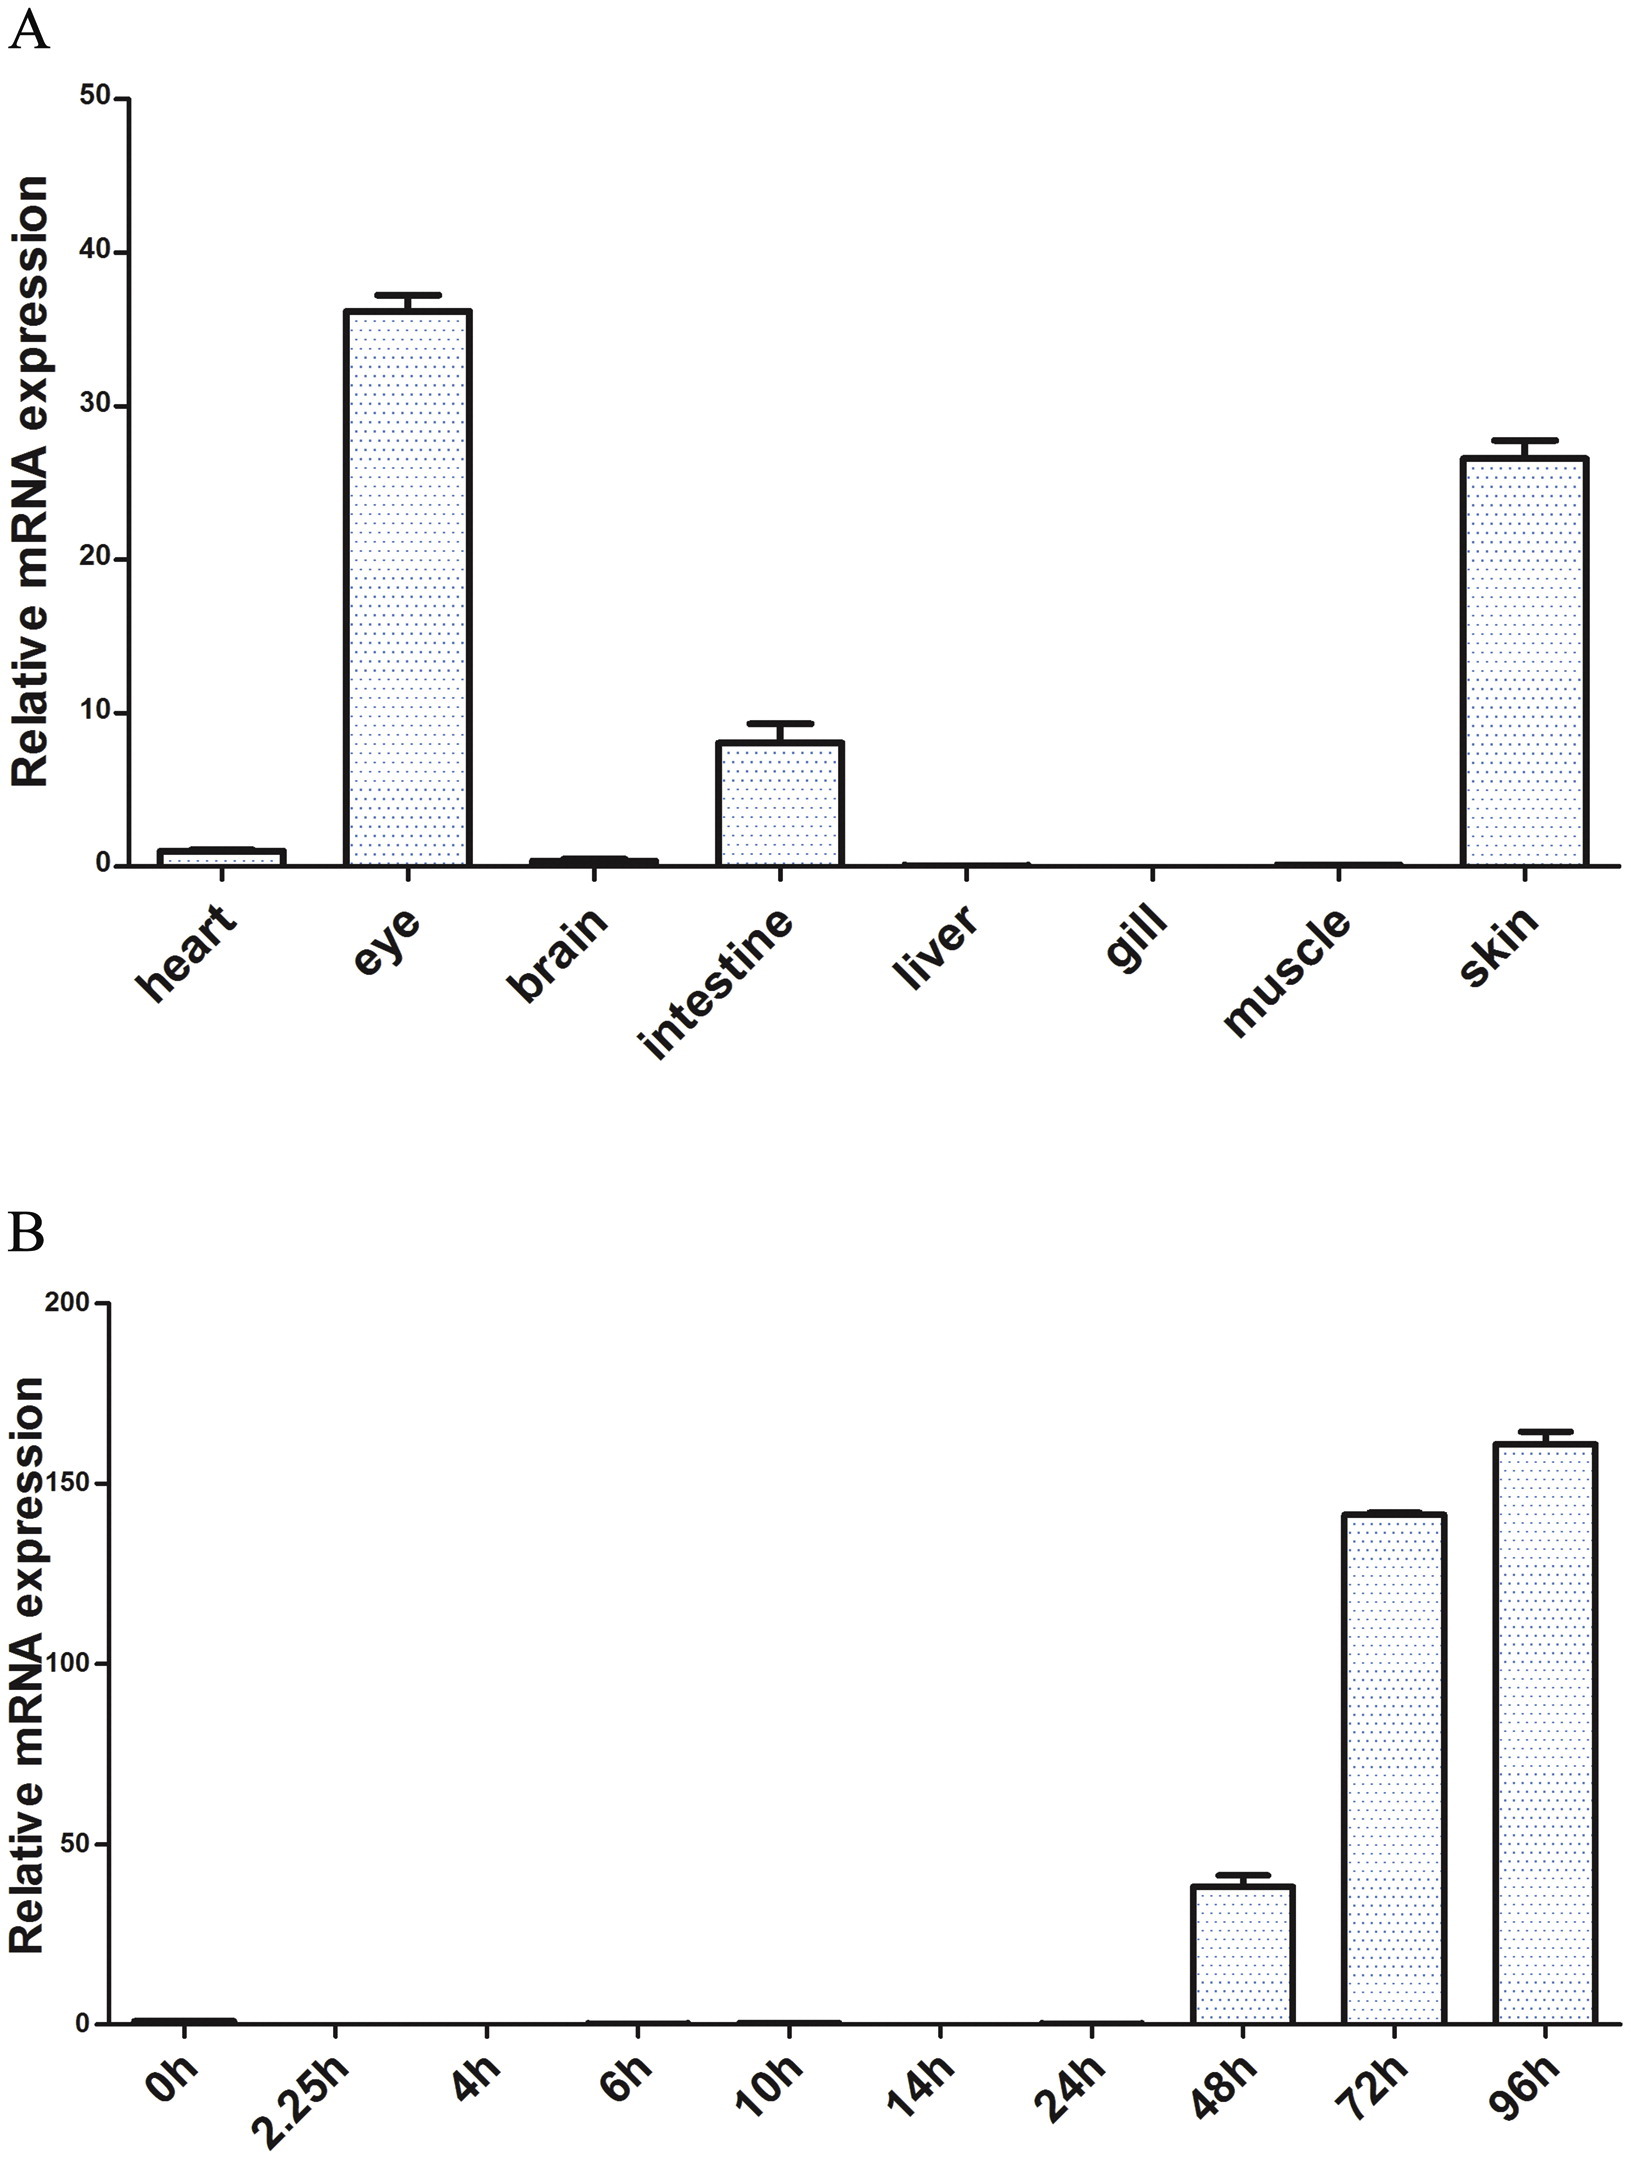
Fig. 2
The expression of lypc by qRT-PCR: (A) Expression profile of lypc at different tissues of adult zebrafish as measured by Real-Time PCR. The mRNA expressions of lypc and β-actin were detected at skin, heart, muscle, gill, liver, intestine, brain, eyes. (B) Expression profile of lypc at different stages of embryonic development as measured by Real-Time PCR. The mRNA expressions of lypc and β-actin were detected at 0 hpf, 2.25 hpf, 4 hpf, 6 hpf, 10 hpf, 14 hpf, 24 hpf, 48 hpf, 72 hpf, 96 hpf. Fold difference was calculated as 2- ΔΔCt with zebrafish β-actin as a reference gene. Vertical bars represent the mean ± SEM (n = 3).
Reprinted from Gene, 574(1), Li, L., Ji, D., Teng, L., Zhang, S., Li, H., Identification and expression of Lypc, a novel dark-inducible member of Ly6 superfamily in zebrafish Danio rerio, 69-75, Copyright (2015) with permission from Elsevier. Full text @ Gene