
|
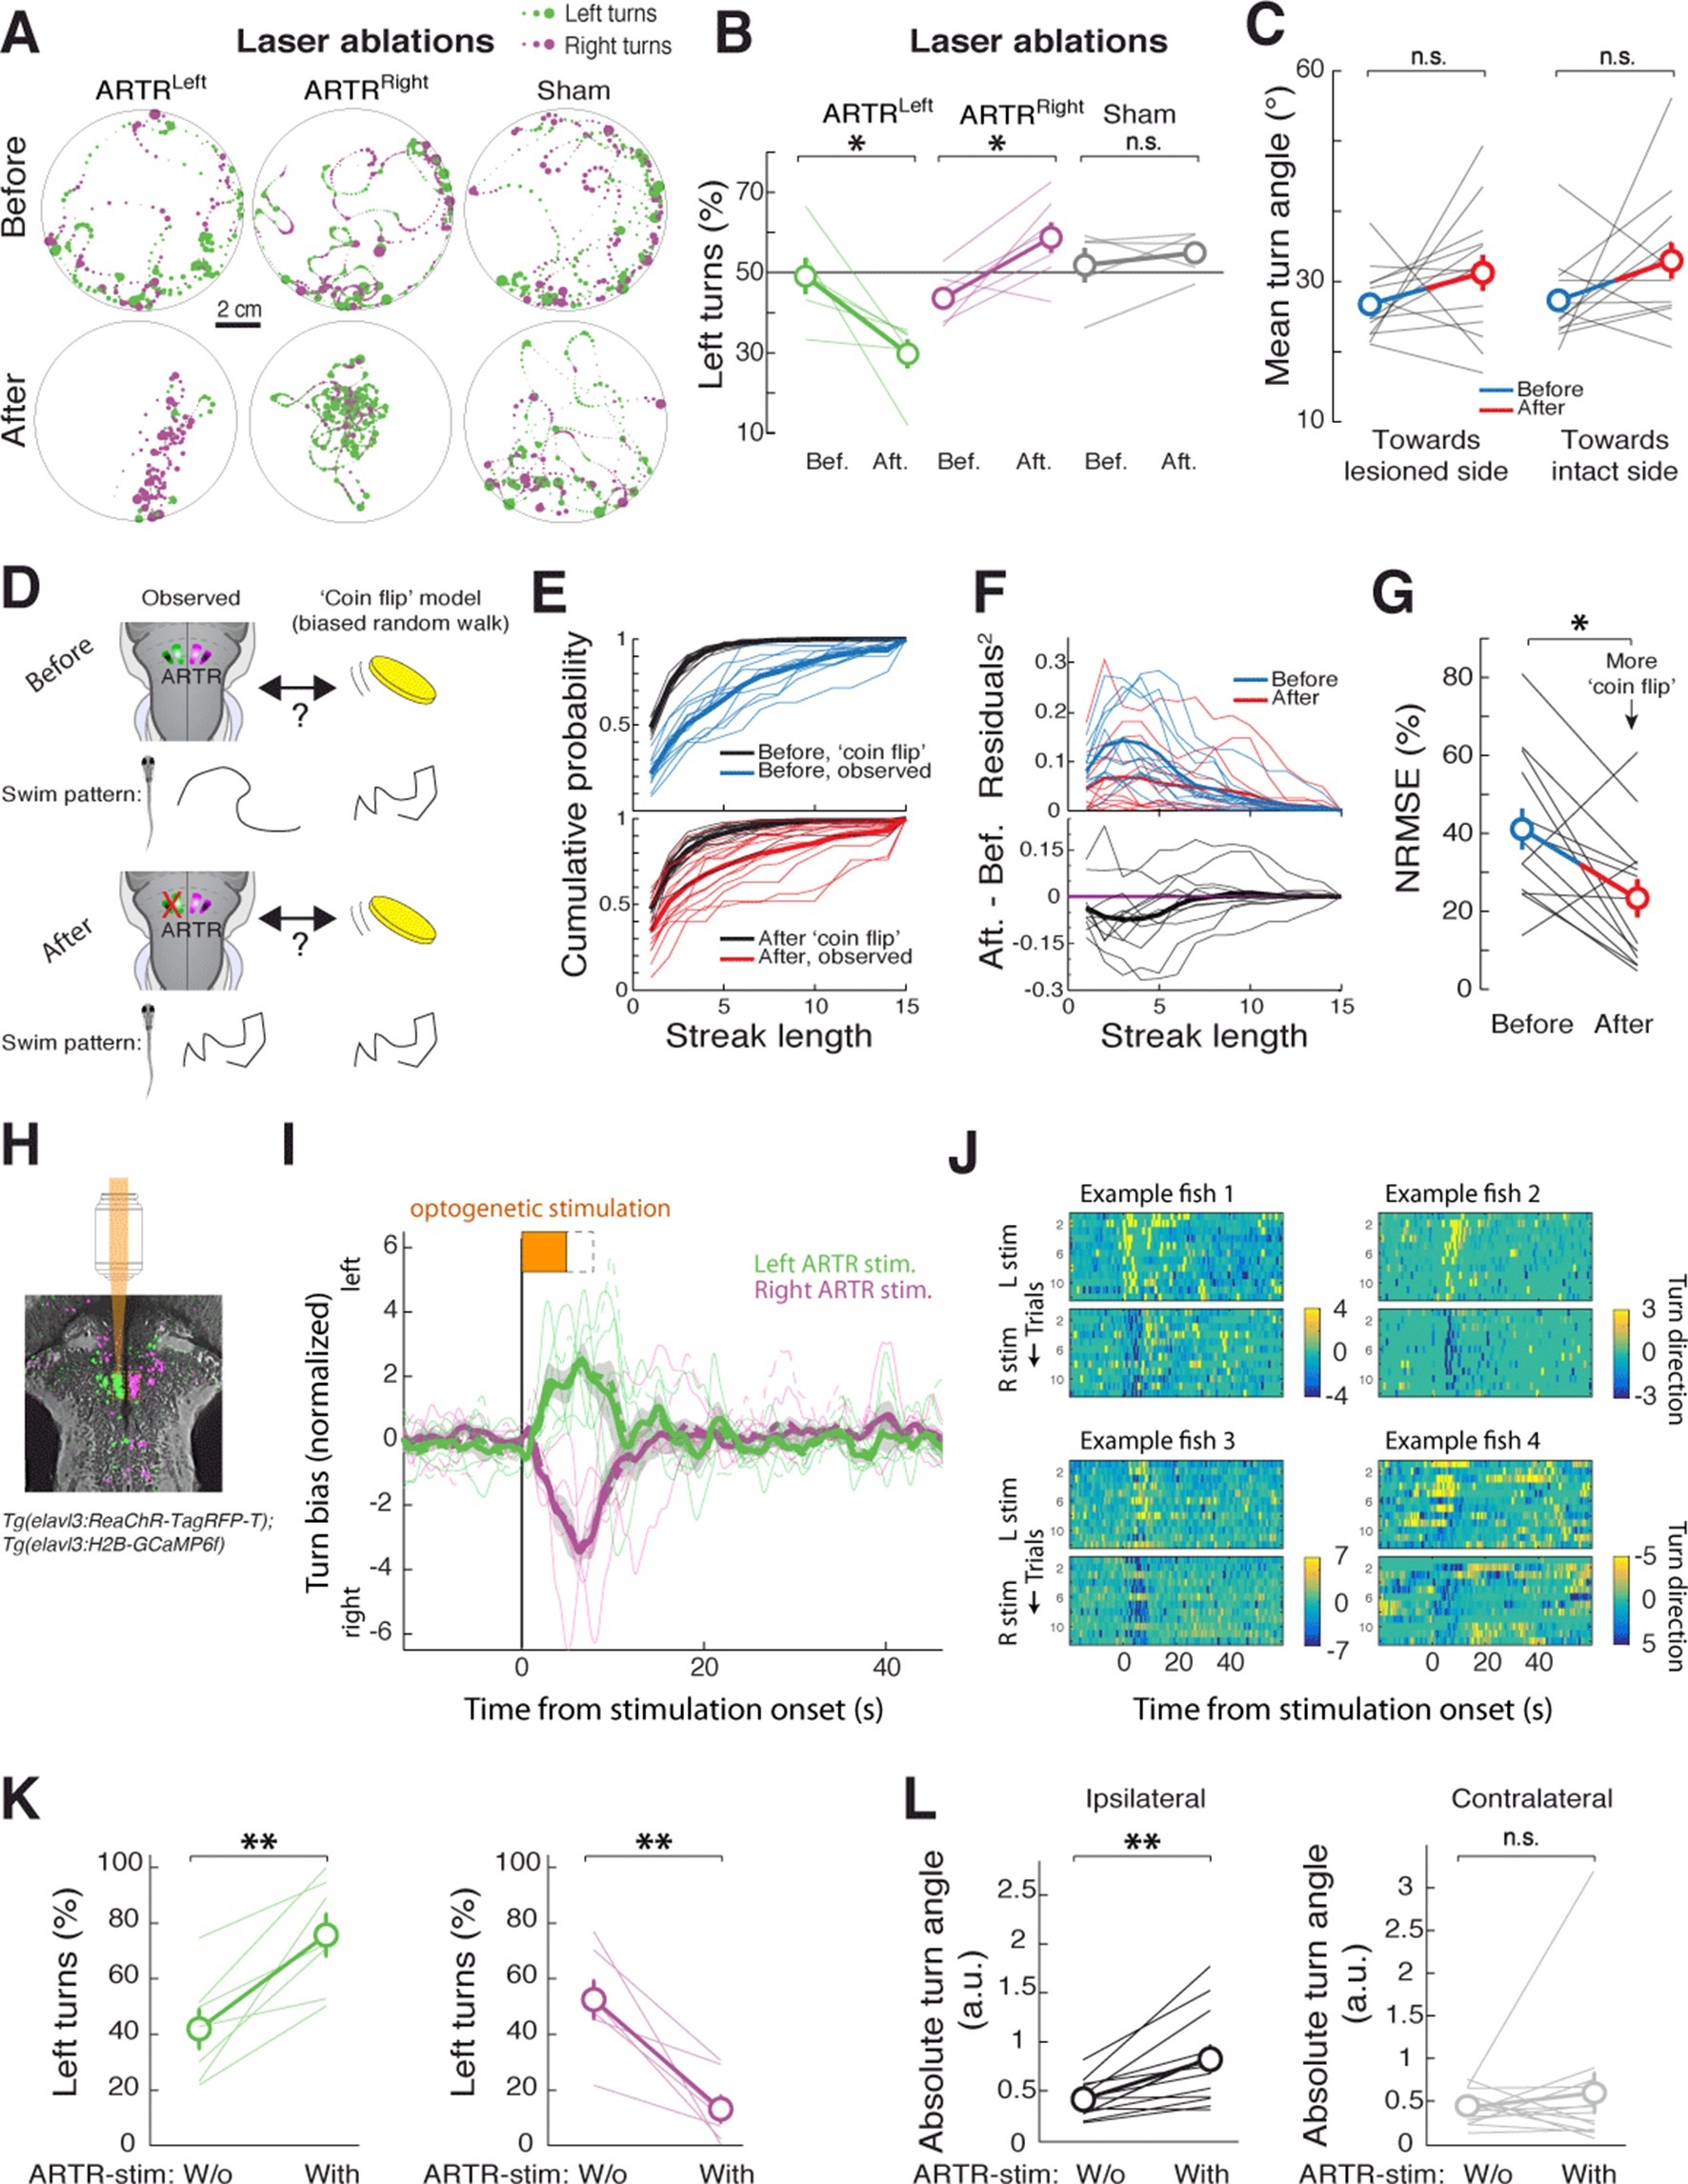
Fig. 4
The ARTR biases turn direction.
(A,B) Unilateral laser ablation of a subset of cells in the ARTR reduces ipsilateral turns. (A) Example swim trajectories, shown over a subset of the duration of the experiment, and (B) summary of turning behavior before and after laser ablation of cells in the left medial cluster (green) or right medial cluster (magenta) of the ARTR. Gray, data from sham ablations of hindbrain neurons outside of the ARTR. Only events occurring more than 1 cm away from the wall were analyzed. (C) Mean turn angle to the lesioned or intact side, before and after ablation. Although the relative frequency of turns to the ablated side decreases (B), fish remain capable of executing turns of normal magnitude to the lesioned side, with no significant difference in mean turn angle between pre- and post-ablation conditions. (D) Schematic of hypothesized changes to swim structure, assuming that the ARTR is involved in setting correlational patterns. Before and after ablation, turn patterns will be compared to a ‘coin flip’ model that emits turns to the left and right randomly but with some bias equal to the observed data. (E) Empirical cumulative distribution functions (CDFs) of streak length before (blue, top) and after (red, bottom) ablation, compared to model fish executing turns at random without history dependence but with overall turn bias matched to each individual fish (black). Streak length post-ablation appears distributed more like ′coin flips′. (F) Top, quantification of the squared residuals between each individual fish CDF and its matched ′coin flip′ CDF before (blue) and after (red) ablation. Bottom, the difference between each respective before and after curve reveals a shift toward the ′coin flip′ distribution for the majority of fish. (G) Summary of the normalized root-mean-square error (NRMSE) quantifying goodness-of-fit between the observed streak distributions and their matched random model distributions. After ablation, turning becomes more ‘coin flip’-like and thus history dependence is reduced. (H-L) Optogenetic stimulation of the ARTR elicits ipsilateral turn biases. (H) The ARTR was functionally identified in double transgenic fish Tg(elavl3:H2B-GCaMP6f;elavl3:ReaChR-TagRFP-T) and a medial ARTR cluster was unilaterally stimulated. Gray, expression of ReaChR-TagRFP-T; green and magenta, functionally identified ARTR from this example fish based on correlational map. (I) Ipsilateral turn bias increases during optogenetic stimulation (solid lines, 5 s stimulation; dotted lines, 8 s stimulation, N = 7 fish, ′Materials and methods′). (J) Results from example fish show the reproducibility of stimulation effect across trials. Turn direction is normalized to time-averaged turn direction pre-stimulation. (K) Summary of the change in bias quantified for each fish, showing that optogenetic stimulation results in a bias toward ipsilateral turns. (L) Summary of the change in absolute fictive turn angle during stimulation, showing that ipsilateral turn angle increases and contralateral turn angle remains unchanged. n.s., no significance; (*) p<0.05; (**) p<0.01 (paired signed rank test). All error bars are mean ± SEM across fish.