
|
Fig. 2 S1
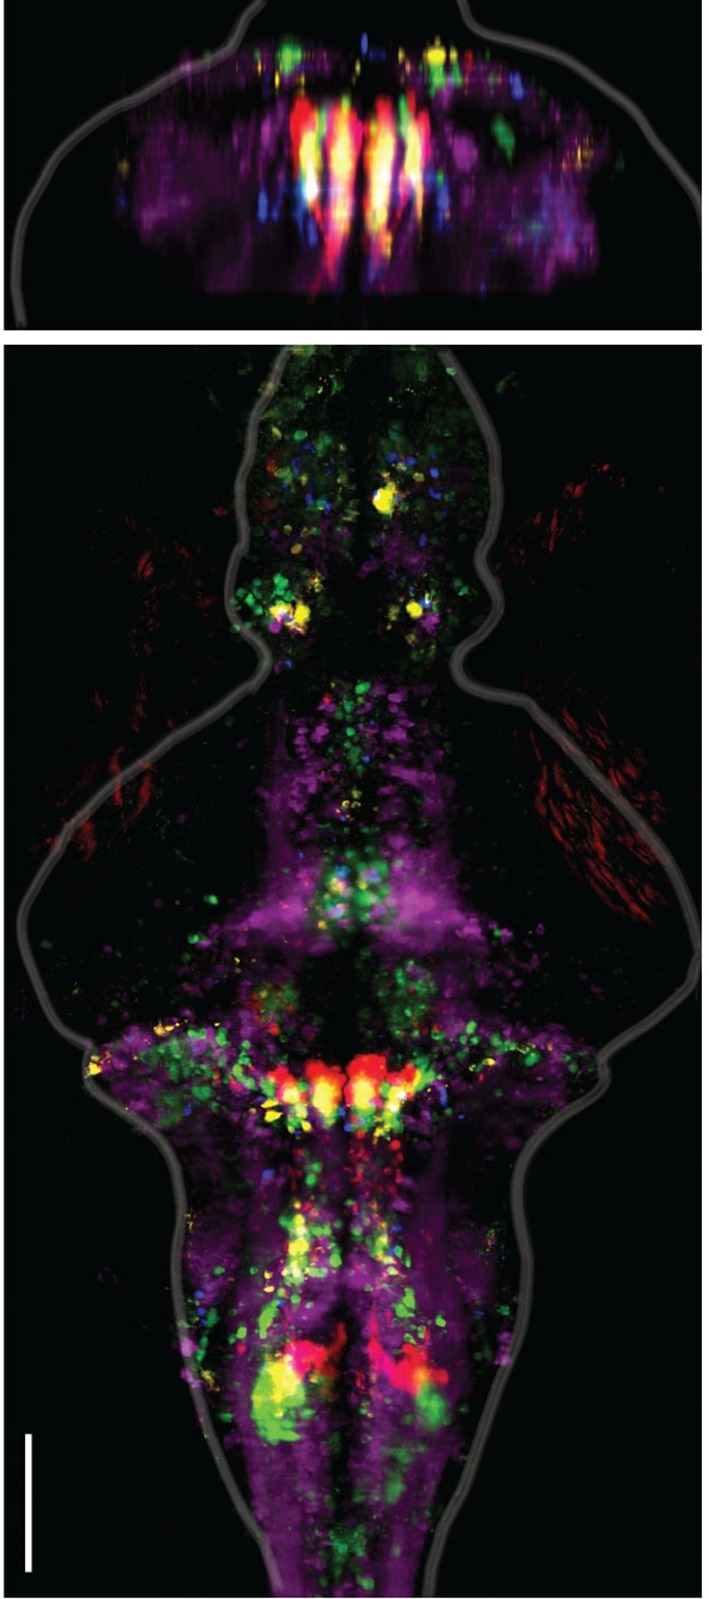
Alignment of functional brain maps in fish expressing calcium indicators in the cytosol.
Shown here is the overlay of brain maps of transgenic zebrafish expressing calcium indicators in the cytosol of neurons (Tg(elavl3:GCaMP6f) and one Tg(elavl3:GCaMP5G) fish). In comparison to Figure 2E, which shows the overlaid maps for fish expressing calcium indicators only in the nuclei of neurons, the functionally identified neurons occupy the same locations, co-localize across fish, and are consistent with the locations of the ARTR as identified in Ahrens et al. 2013. Analyses are identical to those used in Figure 2. Scale bar, 100 µm.