
|
Fig. 1
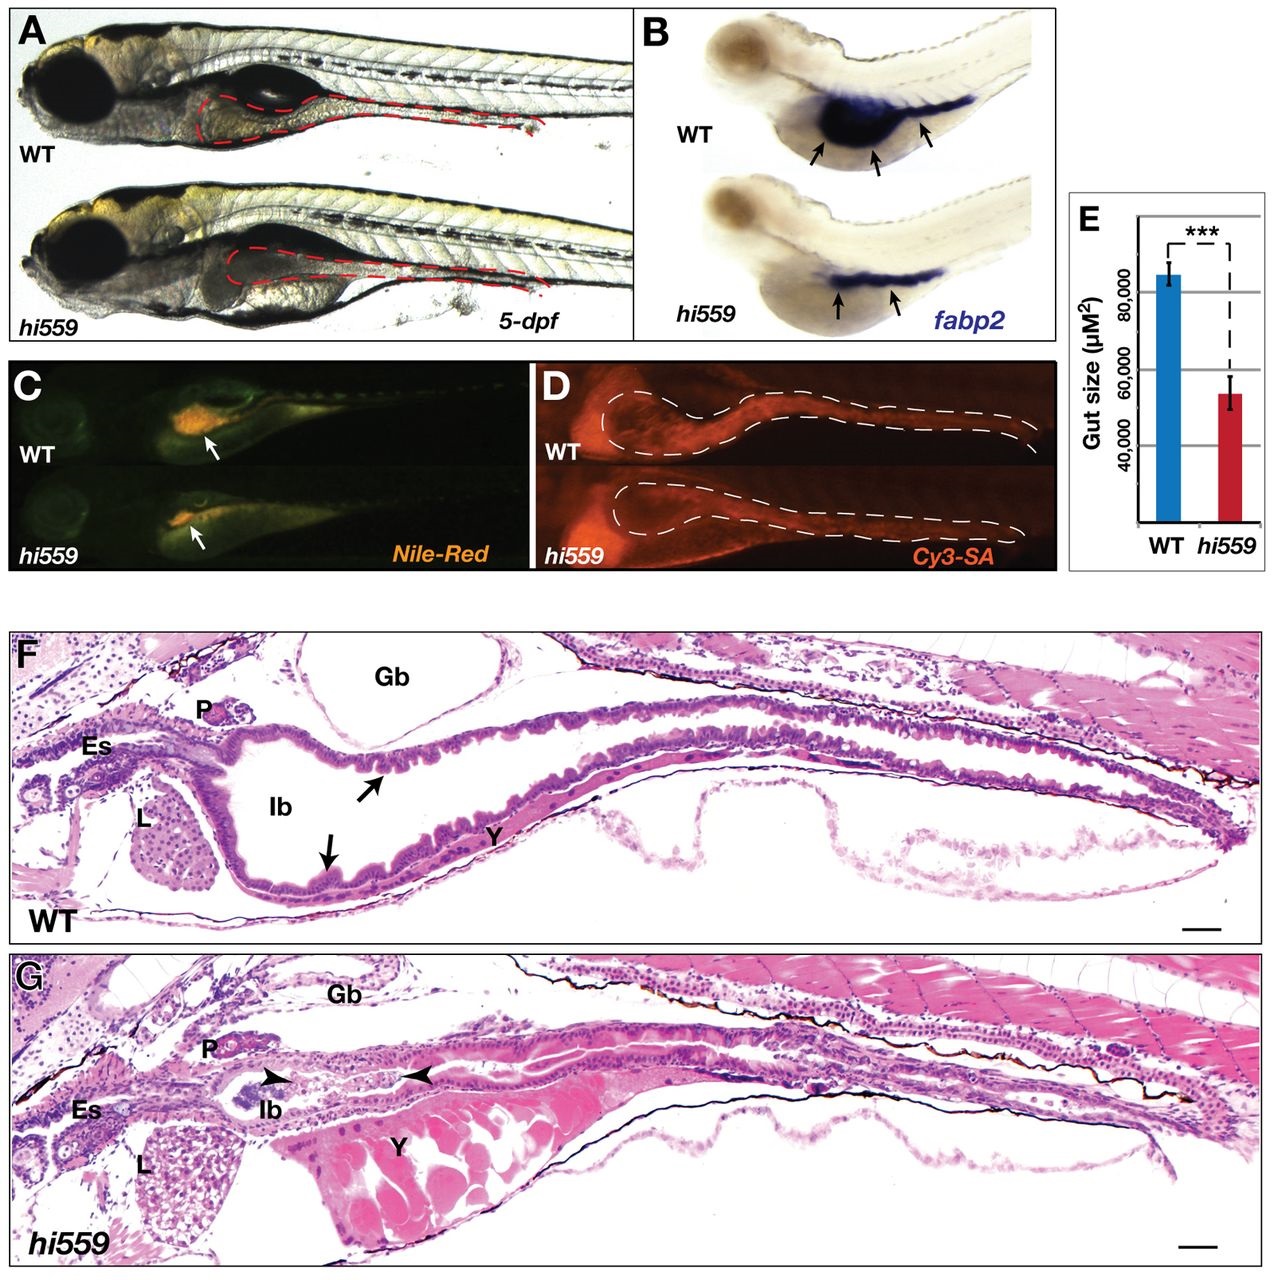
Morphological defects of hi559 GI tract. (A) Intestinal morphology at 5 dpf (brightfield; red outline). (B) ISH with intestinal marker fabp2 (arrows) at 5 dpf. (C) Nile Red staining shows hi559 intestinal luminal atrophy (arrows). (D) Cy3-SA staining shows reduced epithelial structure in hi559 intestine (white outline). (E) Bar chart showing reduced gut size in hi559Tg(gut:gfp) mutant larvae show smaller intestine (n=7, ***P<0.001). (F,G) H&E-stained sagittal sections of 5-dpf wild-type (F) and hi559 larvae (G). The hi559 intestinal epithelium is thinner, loses villous architecture with cellular aggregates in a smaller lumen (villi, arrows; cells and debris, arrowheads). In each panel, wild type (WT) is shown at the top and the hi559 mutant below. Es, esophagus; Gb, gas-bladder; Ib, intestinal bulb; P, pancreas; L, liver; Y, yolk; cm, cell membrane. Scale bars: 20 µm.