
|
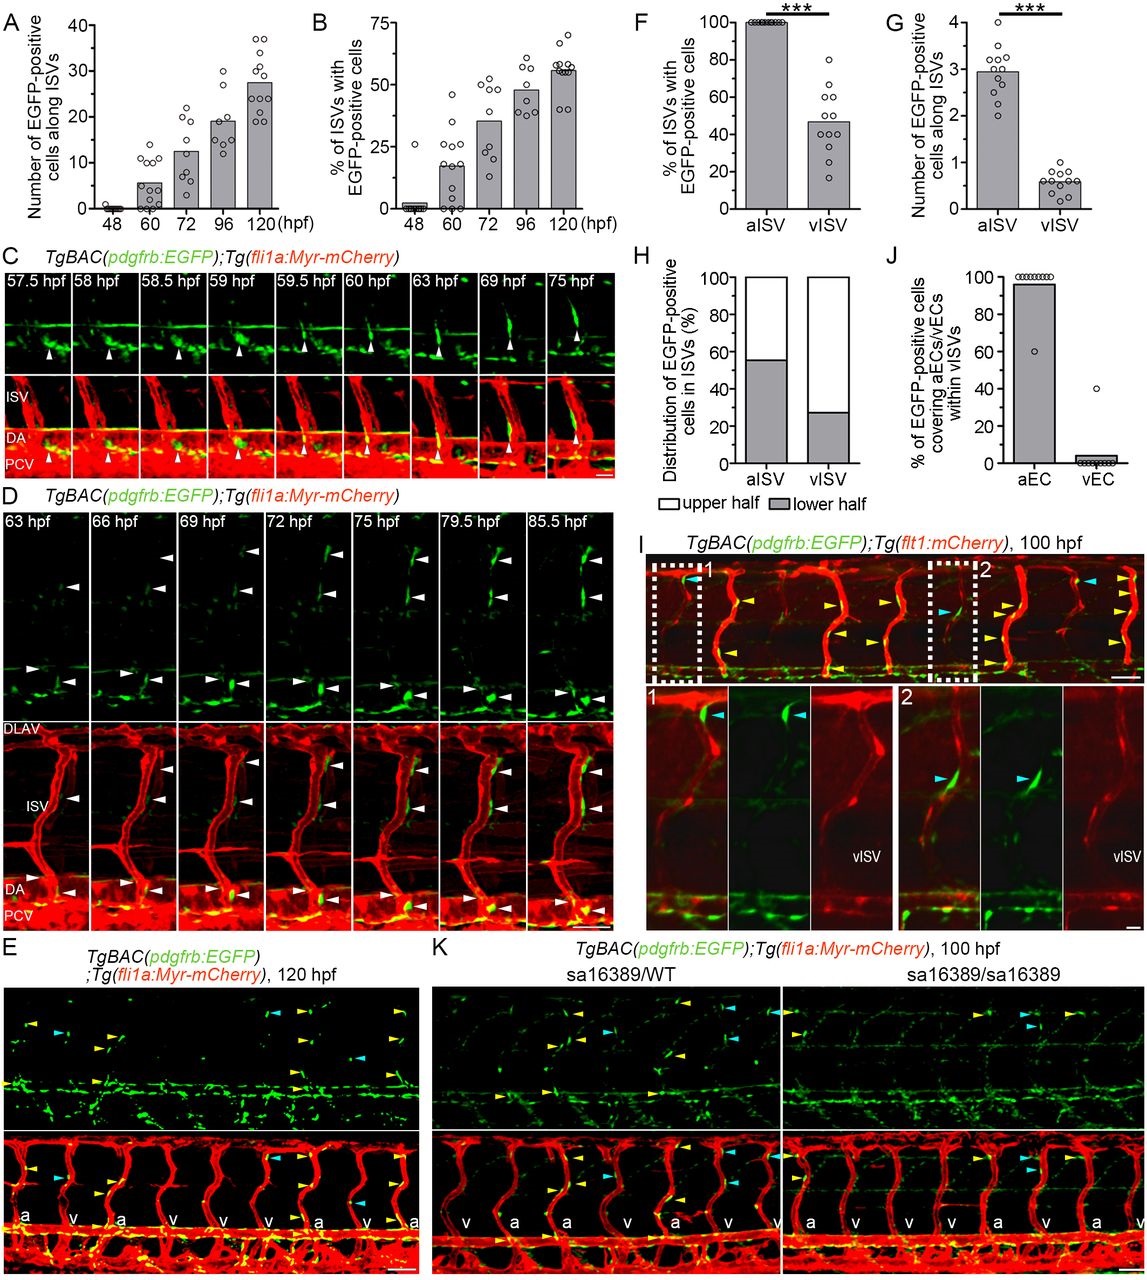
Fig. 5
Live imaging of MC coverage of ISVs. (A,B) The number of EGFP-positive cells covering mCherry-labeled ISVs (A) and the percentage of ISVs covered by more than one EGFP-positive cell (B) in the left side of TgBAC(pdgfrb:EGFP);Tg(fli1a:Myr-mCherry) embryos or larvae at the stages indicated below. (ne8). (C) Time-lapse confocal images of the trunk vasculature in a TgBAC(pdgfrb:EGFP);Tg(fli1a:Myr-mCherry) embryo (57.5-75hpf). Upper, pdgfrb:EGFP; lower, merged image of pdgfrb:EGFP (green) and fli1a:Myr-mCherry (red). Arrowheads indicate an EGFP-positive cell that initially located in the ventral part of DA and subsequently migrated towards the ISV. (D) Time-lapse confocal images of the trunk vasculature in a TgBAC(pdgfrb:EGFP);Tg(fli1a:Myr-mCherry) embryo (63-85.5hpf), as in C. Arrowheads indicate EGFP-positive cells covering the ISVs. Note that the cells around the ISVs gradually emitted a stronger EGFP signal. (E) Confocal images of trunk vasculature in a TgBAC(pdgfrb:EGFP);Tg(fli1a:Myr-mCherry) larva at 120hpf. Upper, pdgfrb:EGFP; lower, merged image of pdgfrb:EGFP (green) and fli1a:Myr-mCherry (red). Yellow and blue arrowheads indicate the EGFP-positive cells covering arterial ISVs (aISVs) and those covering venous ISVs (vISVs), respectively. ‘a’ and ‘v’ in the merged image indicate aISVs and vISVs, respectively. (F) Percentage of aISVs/vISVs covered by more than one EGFP-positive cell, as observed in E (n≥12). (G) The number of EGFP-positive cells covering aISVs/vISVs, as observed in E (n≥12). (H) Percentage of EGFP-positive cells covering the upper and lower half of aISVs/vISVs, as observed in E (n=12). (I) Confocal images of trunk vasculature in a TgBAC(pdgfrb:EGFP);Tg(flt1:mCherry) larva at 100hpf. Fluorescence signal derived from flt1:mCherry labels arterial ECs (Bussmann et al., 2010). The merged image of pdgfrb:EGFP (green) and flt1:mCherry (red) is shown at the top. The boxed areas labeled 1 and 2 are enlarged at the bottom, showing the merged image of pdgfrb:EGFP and flt1:mCherry (left), pdgfrb:EGFP (center) and flt1:mCherry (right). Yellow and blue arrowheads indicate the EGFP-positive cells covering aISVs and those covering vISVs, respectively. Note that MCs adhered to the flt1:mCherry-positive arterial ECs within vISVs. (J) Percentage of EGFP-positive cells adhering to arterial ECs (aEC) and those adhering to venous ECs (vECs) within vISVs, as observed in I (n=10). (K) Confocal images of trunk vasculature of the pdgfrb heterozygous (sa16389/WT) and homozygous (sa16389/sa16389) larvae in the TgBAC(pdgfrb:EGFP);Tg(fli1a:Myr-mCherry) background at 100hpf are shown, as in E. In A,B,F,G and J, bars and circles indicate averages and individual values, respectively. ***P<0.001. Lateral view, anterior to the left. DLAV, dorsal longitudinal anastomotic vessel; ISV, intersegmental vessel; DA, dorsal aorta; PCV, posterior cardinal vein; aISV, arterial ISV; vISV, venous ISV. Scale bars: 20µm (C, enlarged images in I); 50µm (D,E,I,K).