
|
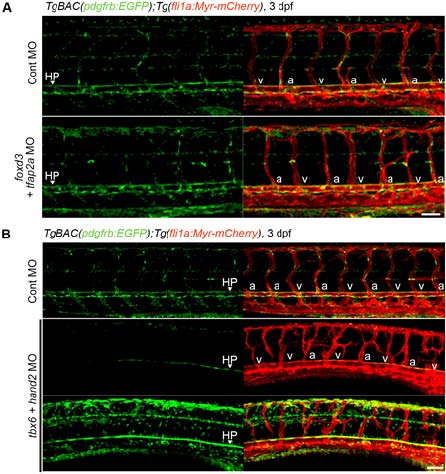
Fig. S6
Investigation of the origin of the MCs in trunk vessels. (A) Confocal images of trunk vasculature in the 3 dpf TgBAC(pdgfrb:EGFP);Tg(fli1a:Myr-mCherry) larvae injected with control MO (upper) or both foxd3 and tfap2a MOs(lower). Left, pdgfrb:EGFP; right, the merged images of pdgfrb:EGFP(green) and fli1a:Myr-mCherry(red).(B) Confocal images of trunk vasculature in the 3 dpf TgBAC(pdgfrb:EGFP);Tg(fli1a:Myr-mCherry) larvae injected with control MO (top) or both tbx6 and hand2 MOs (middle and bottom). Left, pdgfrb:EGFP; right, the merged images of pdgfrb:EGFP(green) and fli1a:Myr-mCherry(red).In the bottom panel, GFP signal is intensified to detect the weak signal. HP, hypochord. “a” and “v” indicate arterial ISVs (aISV) and venous ISVs (vISV), respectively. Scale bars, 50 µm.