
|
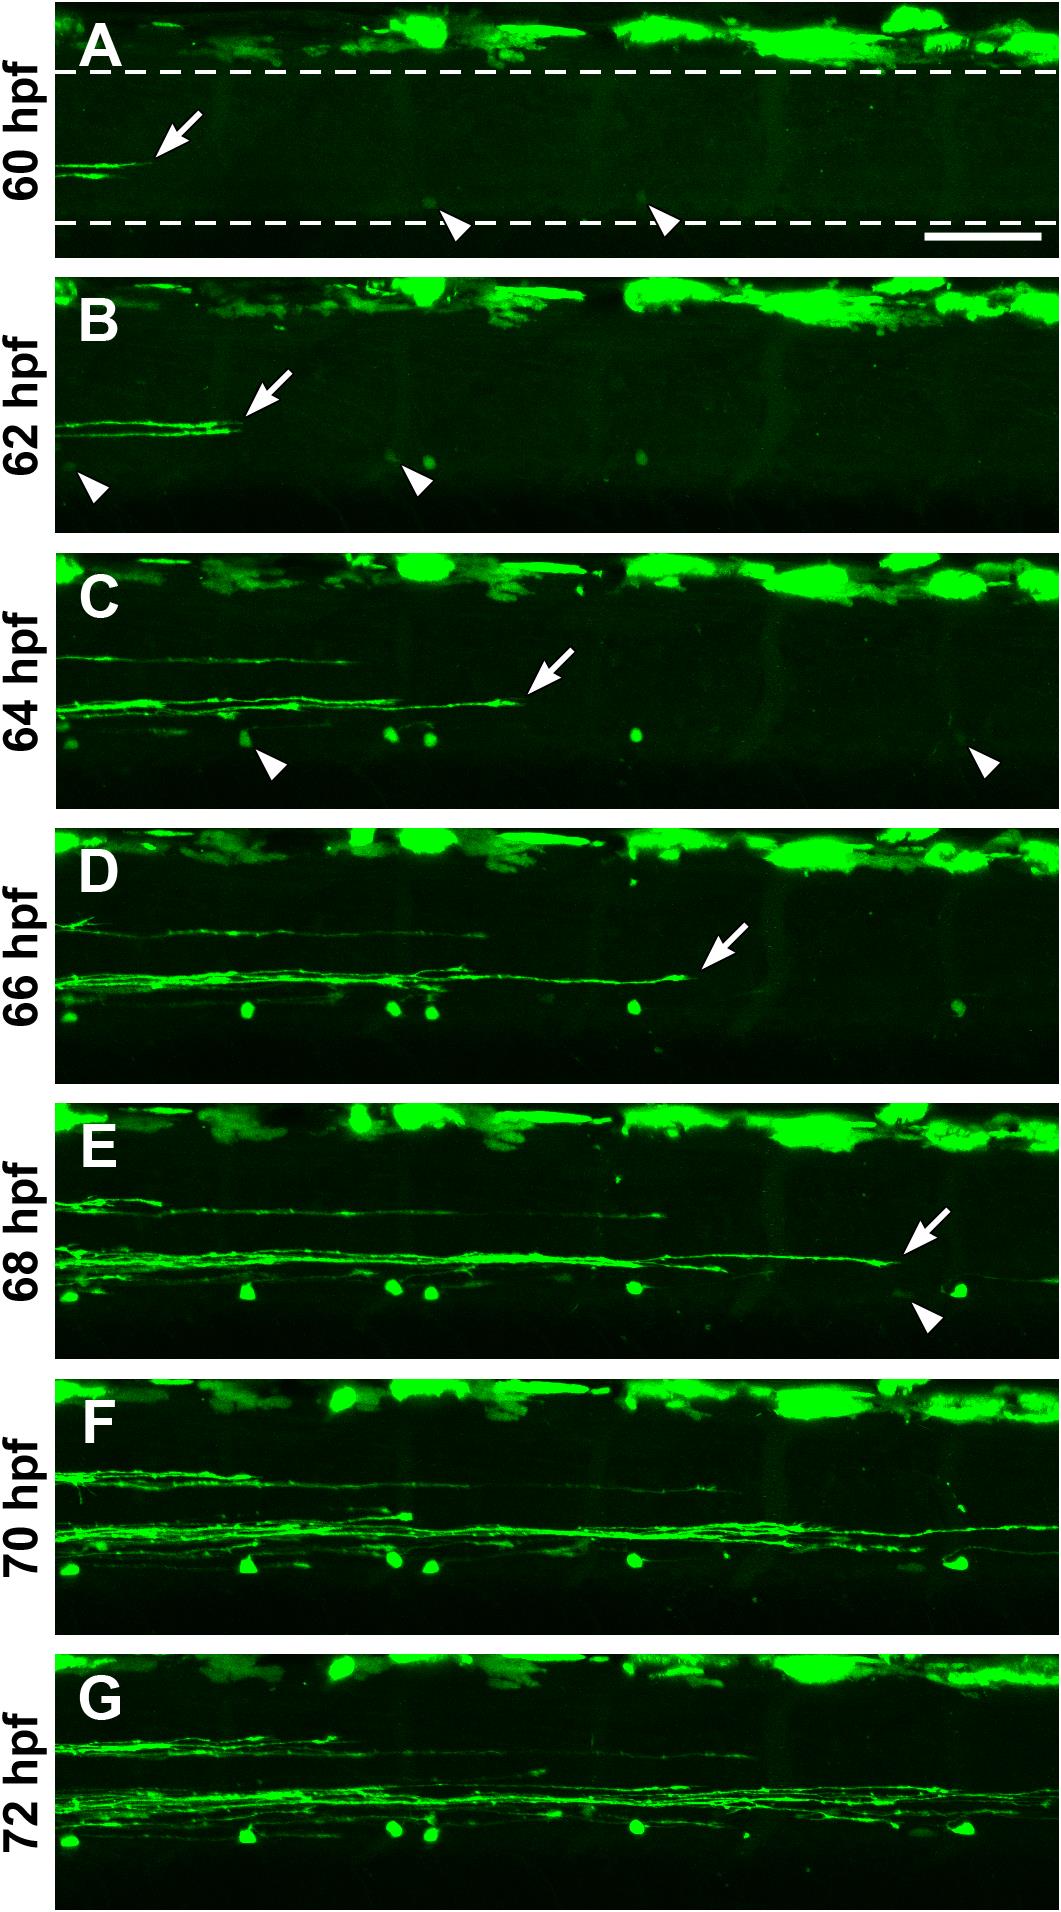
Fig. S1
Visualization of developing spinal pet1:EGFP+ neurons and descending raphe projections. An anesthetized 60 hpf Tg(-3.2pet1:EGFP)ne0214 larva was embedded laterally in agarose. Images centered on the midbody (body segment 15) were collected using a confocal microscope every two hours between 60 and 72 hpf. The larva was maintained at 28.5°C when not being imaged. Arrows indicate the most caudal descending raphe projection at each age and arrowheads indicate pet1:EGFP+ cells as they first became visible. A: At 60 hpf, raphe projections were present in the most rostral region of the field of view (arrow). Two faintly pet1:EGFP+ cells were visible in the ventral spinal cord (A; dashed lines represent the dorsal and ventral boundaries of the spinal cord, approximately same position in all panels). B and C: Raphe projections extended further caudally (arrows) and additional cell bodies were detected (arrowheads) at 62 (B) and 64 hpf (C). D and E: Raphe projections continued to grow in a caudal direction at 64 and 68 hpf (D and E, arrows) and one additional cell was observed (arrowhead) at 68 hpf (E). F and G: Raphe fibers extended across the entire field of view and no new cells were detected at 70 (F) and 72 (G) hpf. Scale bar = 50 µm.