
|
Fig. 2
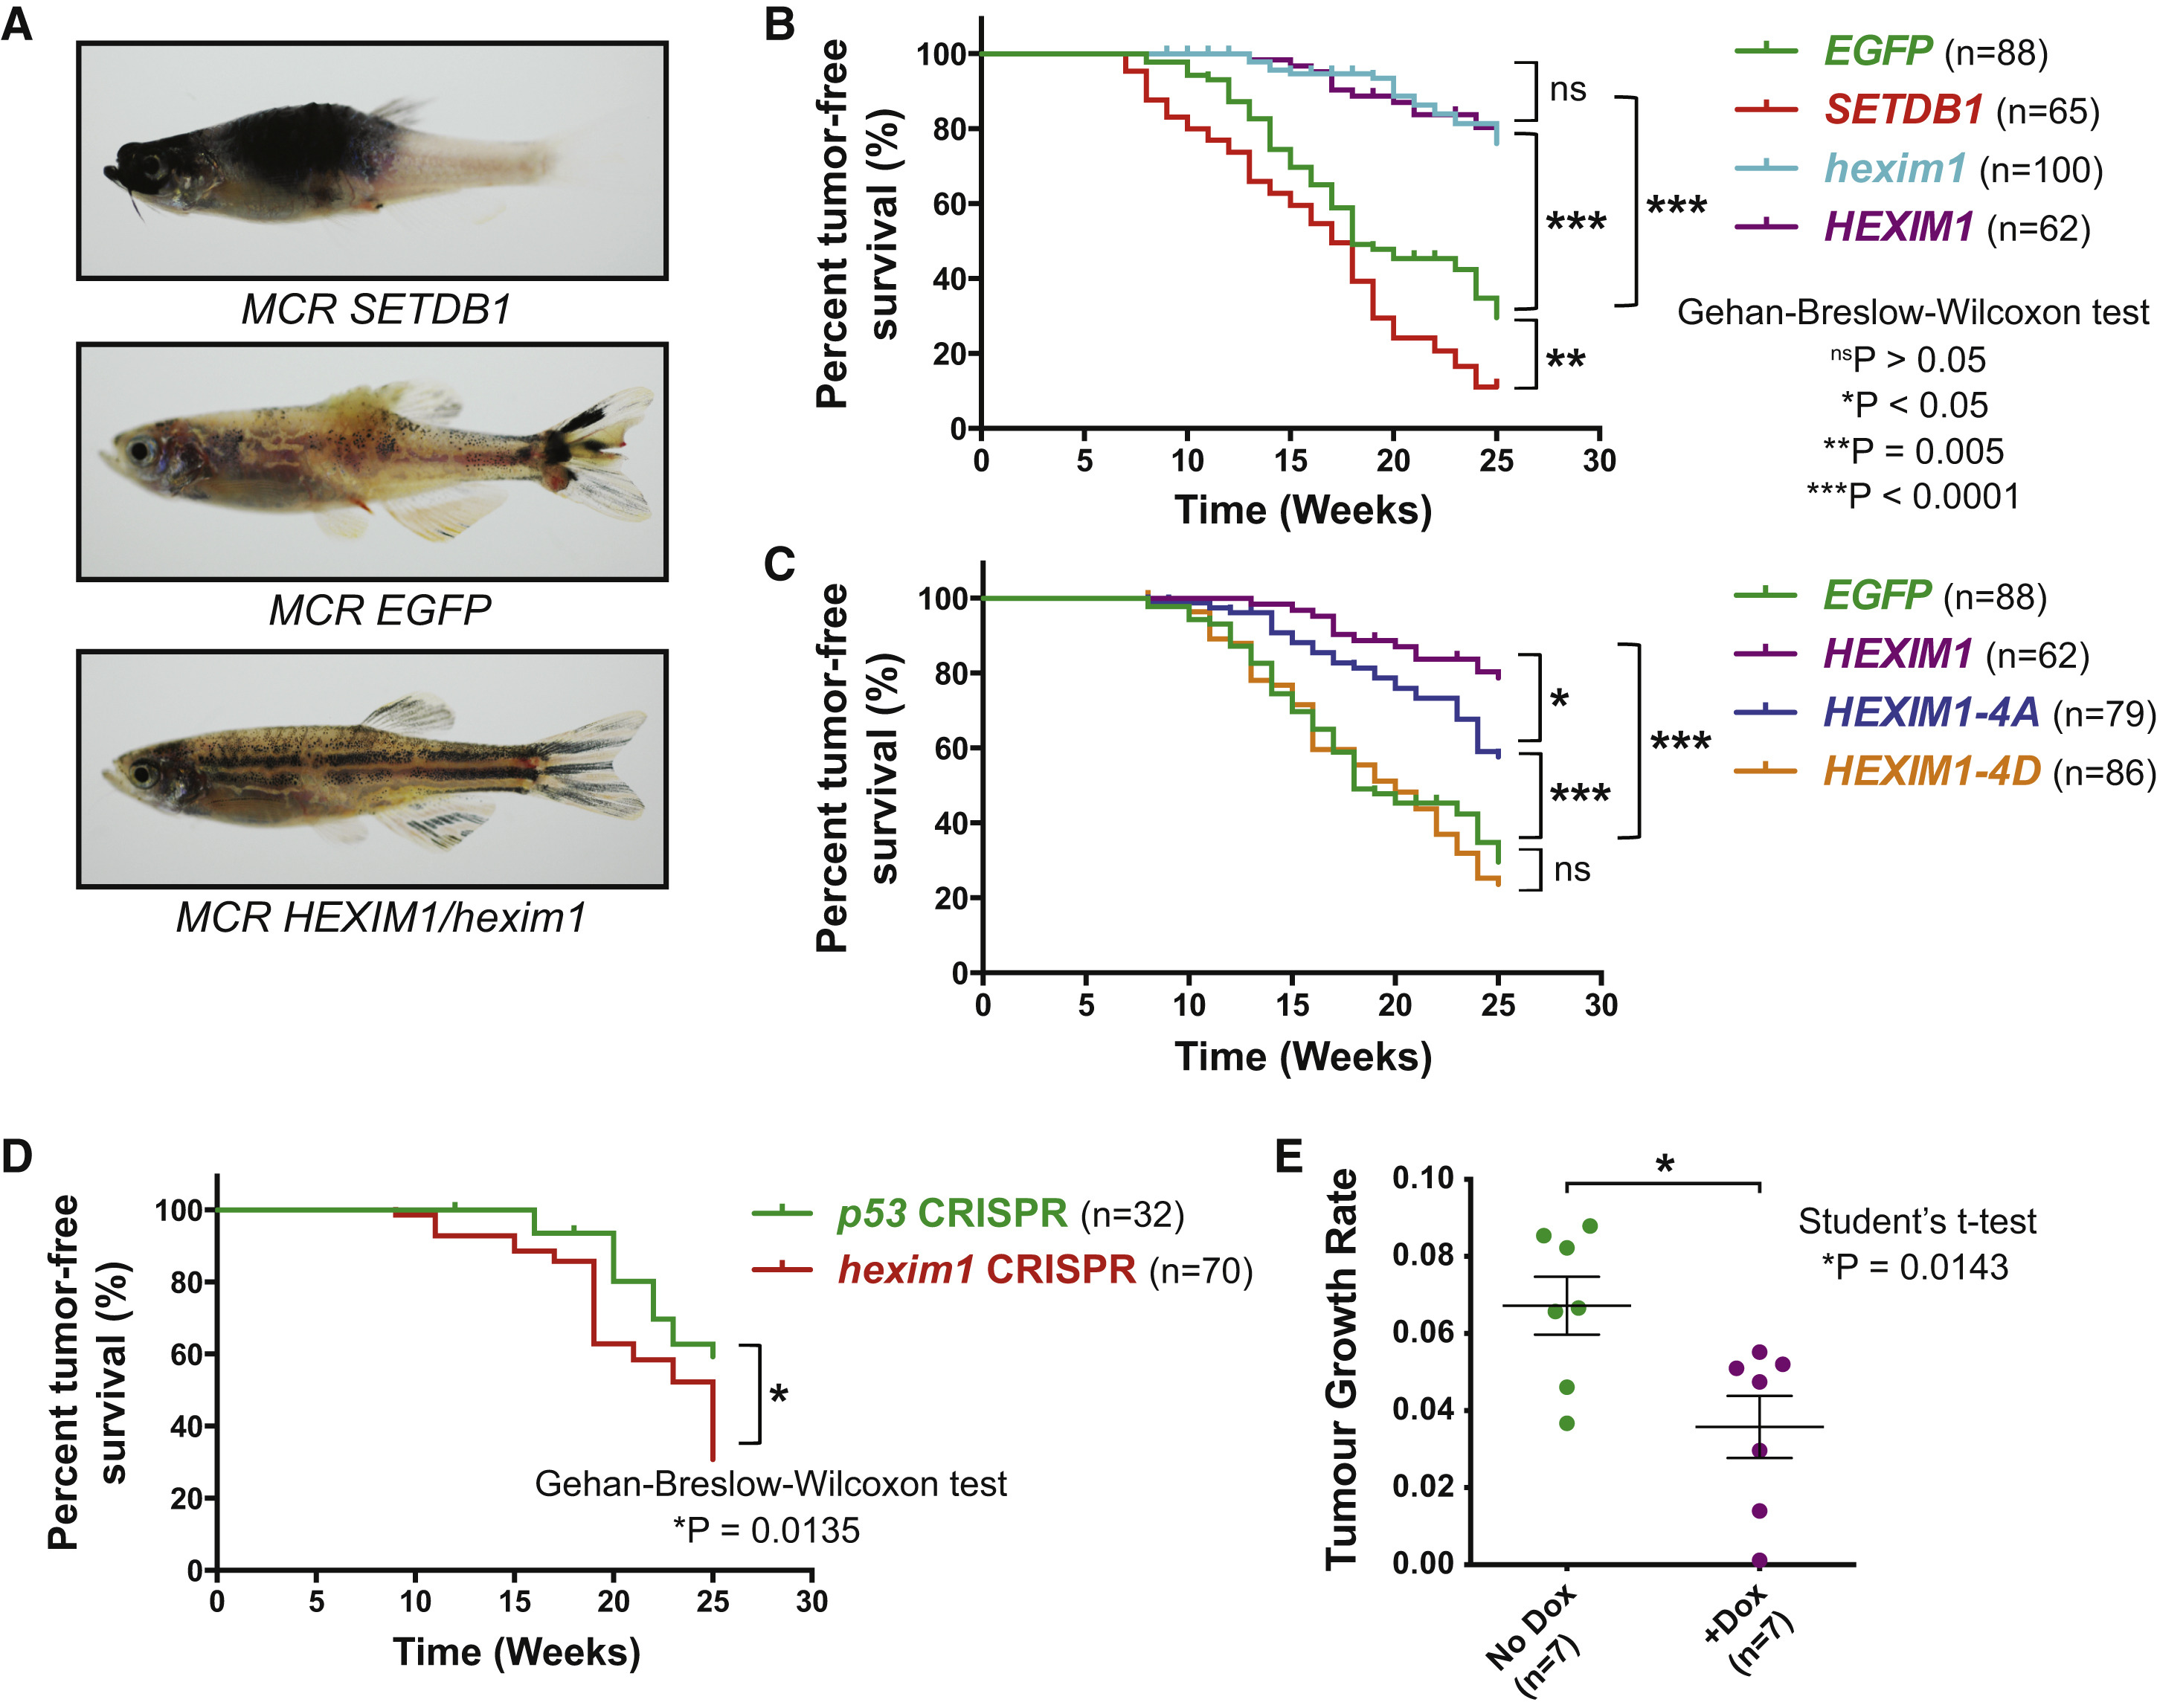
HEXIM1 Activity Suppresses Melanoma In Vivo
(A) 19-week-old Tg(mitfa:BRAFV600E);p53-/-;mitfa-/- zebrafish are shown with rescued melanocytes expressing tumor accelerator SETDB1, background control EGFP, or HEXIM1/hexim1 in the MiniCoopR system.
(B) Tumor-free survival curves for EGFP, SETDB1, and HEXIM1/hexim1 MiniCoopR zebrafish over 25 weeks. Percentages of the total number of zebrafish that were tumor free each week are plotted.
(C) Tumor-free survival curves for MiniCoopR overexpression of human HEXIM1-4A, and HEXIM1-4D are shown.
(D) Tumor-free survival curves for MiniCoopR expression of p53 and hexim CRISPRs are shown.
(E) Tumor growth rates of individual mouse xenografts with a Tet-On HEXIM1-inducible A375 cell line (A375-HEXIM1) over 14 days. Mice were fed either a standard diet or doxycycline diet (mean of seven replicates ± SD).
See also Figure S2.