
|
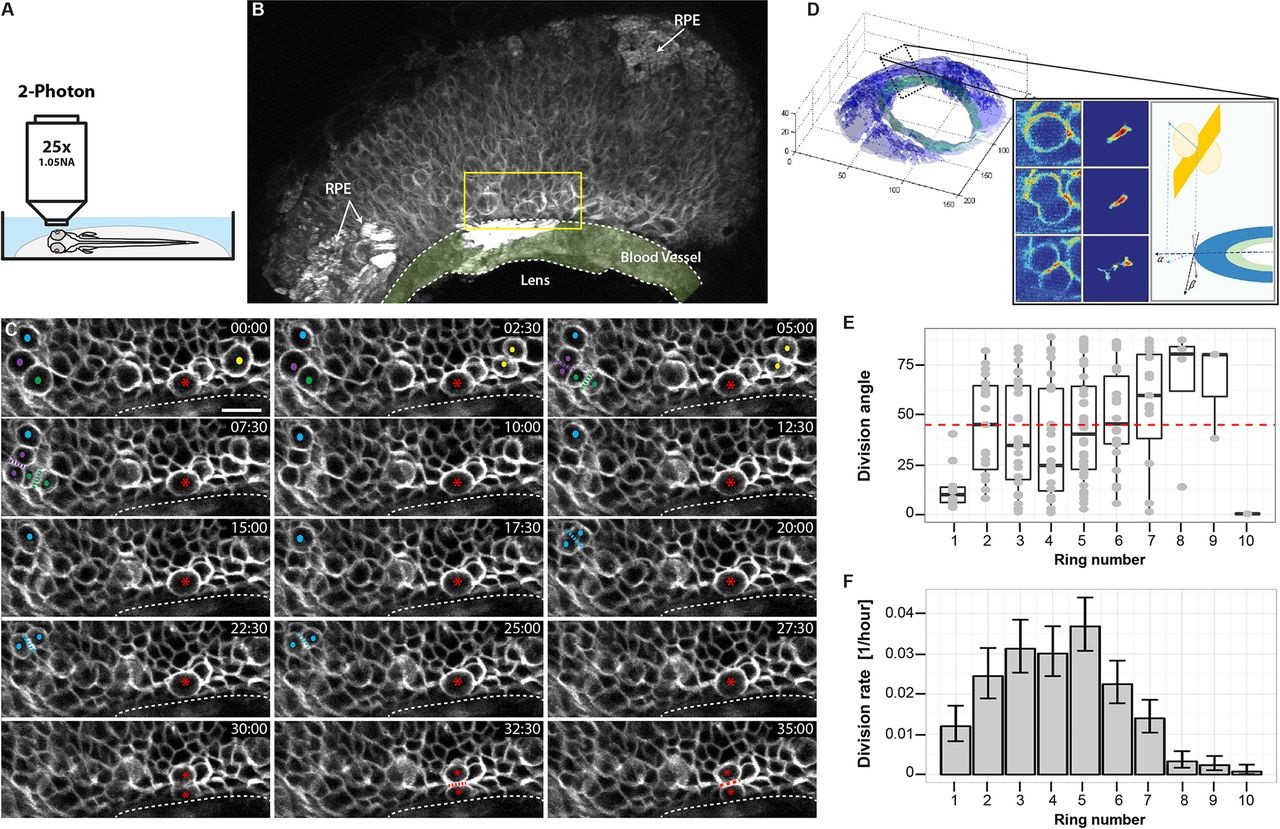
Fig. 4
Live imaging of cell division in the CMZ. (A) Schematic illustration of the two-photon imaging set-up. (B) 3D projection of one movie frame (t=69, z=16.5µm), showing the CMZ region imaged. Arrows indicate areas of retinal pigment epithelium (RPE). Yellow rectangle represents the area shown in the following panels. The ring blood vessel is shaded light green. (C) Selected frames of a 4D time-lapse movie showing several cell divisions in a variety of orientation planes. Dividing cells are labelled with a coloured dot. A presumptive stem cell, dividing parallel to the edge of the retina close to the blood vessel, is labelled with a red asterisk. Each frame represents a maximum intensity projection (six frames, z=4.5µm). Elapsed time shown in min:s. Dotted line indicates the edge of the blood vessel. Scale bar: 10µm. (D) Computation of division angle. The 3D image stack is segmented into retina (blue) and blood vessel (green). Inset panel shows how the pixels belonging to the divisions are detected by analysing the difference between two consecutive or temporally close frames (depending on the time resolution of the imaging) and finding large contiguous volumes of statistically significant pixels in the difference image, followed by a manual validation step (see supplemental Materials and Methods). Once the divisions are detected, the normal of the division plane (yellow) is estimated and projected in the CMZ plane and the angle between the projected normal and the tangent to the CMZ circle at the closest point is computed. (E) Box plot of division angles detected in each ring of cells in the CMZ. Ring 1 cells divide more strictly axially compared with the random distribution in higher rings. Boxes span the first to the third quartile. Whiskers extend from the lowest value still within 1.5 interquartile range (IQR) of the lower quartile to the highest value still within 1.5 IQR of the upper quartile. (F) Estimated division rate in each ring of cells in the CMZ. Division rate is defined as the number of divisions observed divided by the number of cells imaged in the corresponding ring. Error bars represent one sigma confidence interval of Poisson distribution.