
|
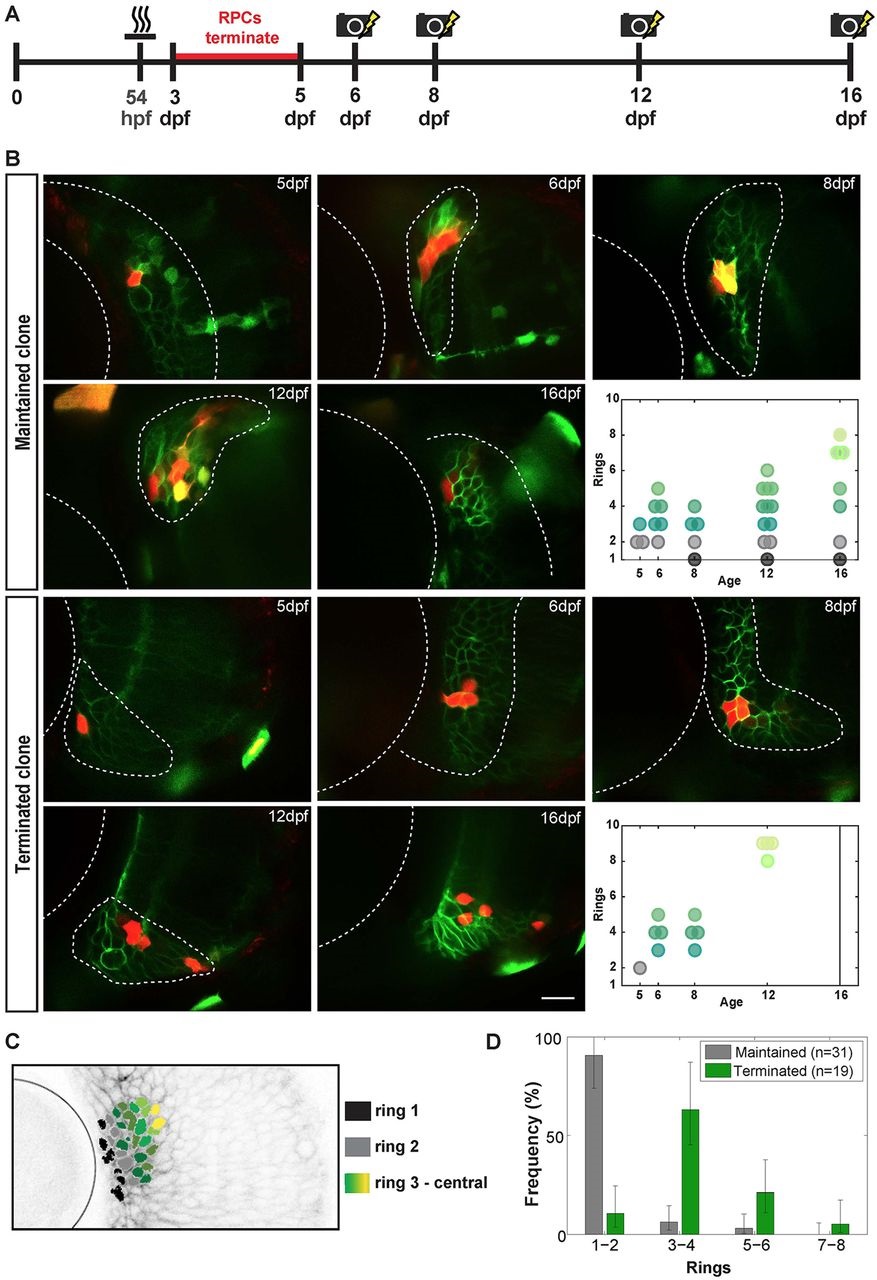
Fig. 2
Long-term polyclonal analysis. (A) Experimental procedure for labelling 5dpf CMZ clones and following the maintaining CMZ polyclones at subsequent time points. (B) Photoconverted CMZ cells (red) at 5, 6, 8, 12 and 16dpf, with the top two rows showing a maintained polyclone and bottom two rows a terminated polyclone at 16dpf. Rx2+ cells have green membranes whereas the MAZe:Kaede cells have green cytoplasm that becomes red upon photoconversion. Yellow areas indicate colocalization of signals. Scale bar: 20µm. The final panels in each series show the clonal geometry of each of these two clones. Black circles indicate ring 1; grey circles, ring 2; dark green to light green, rings 3-8. (C) Frontal view of an Rx2+ retina, with the cell ring position coded in colour (as shown in key). (D) Distribution of the position of the most peripheral cells in clones on the last observed day for all maintained clones (n=31) and the corresponding value for all terminated clones before termination (n=19). Error bars represents one sigma confidence interval of Poisson distribution.