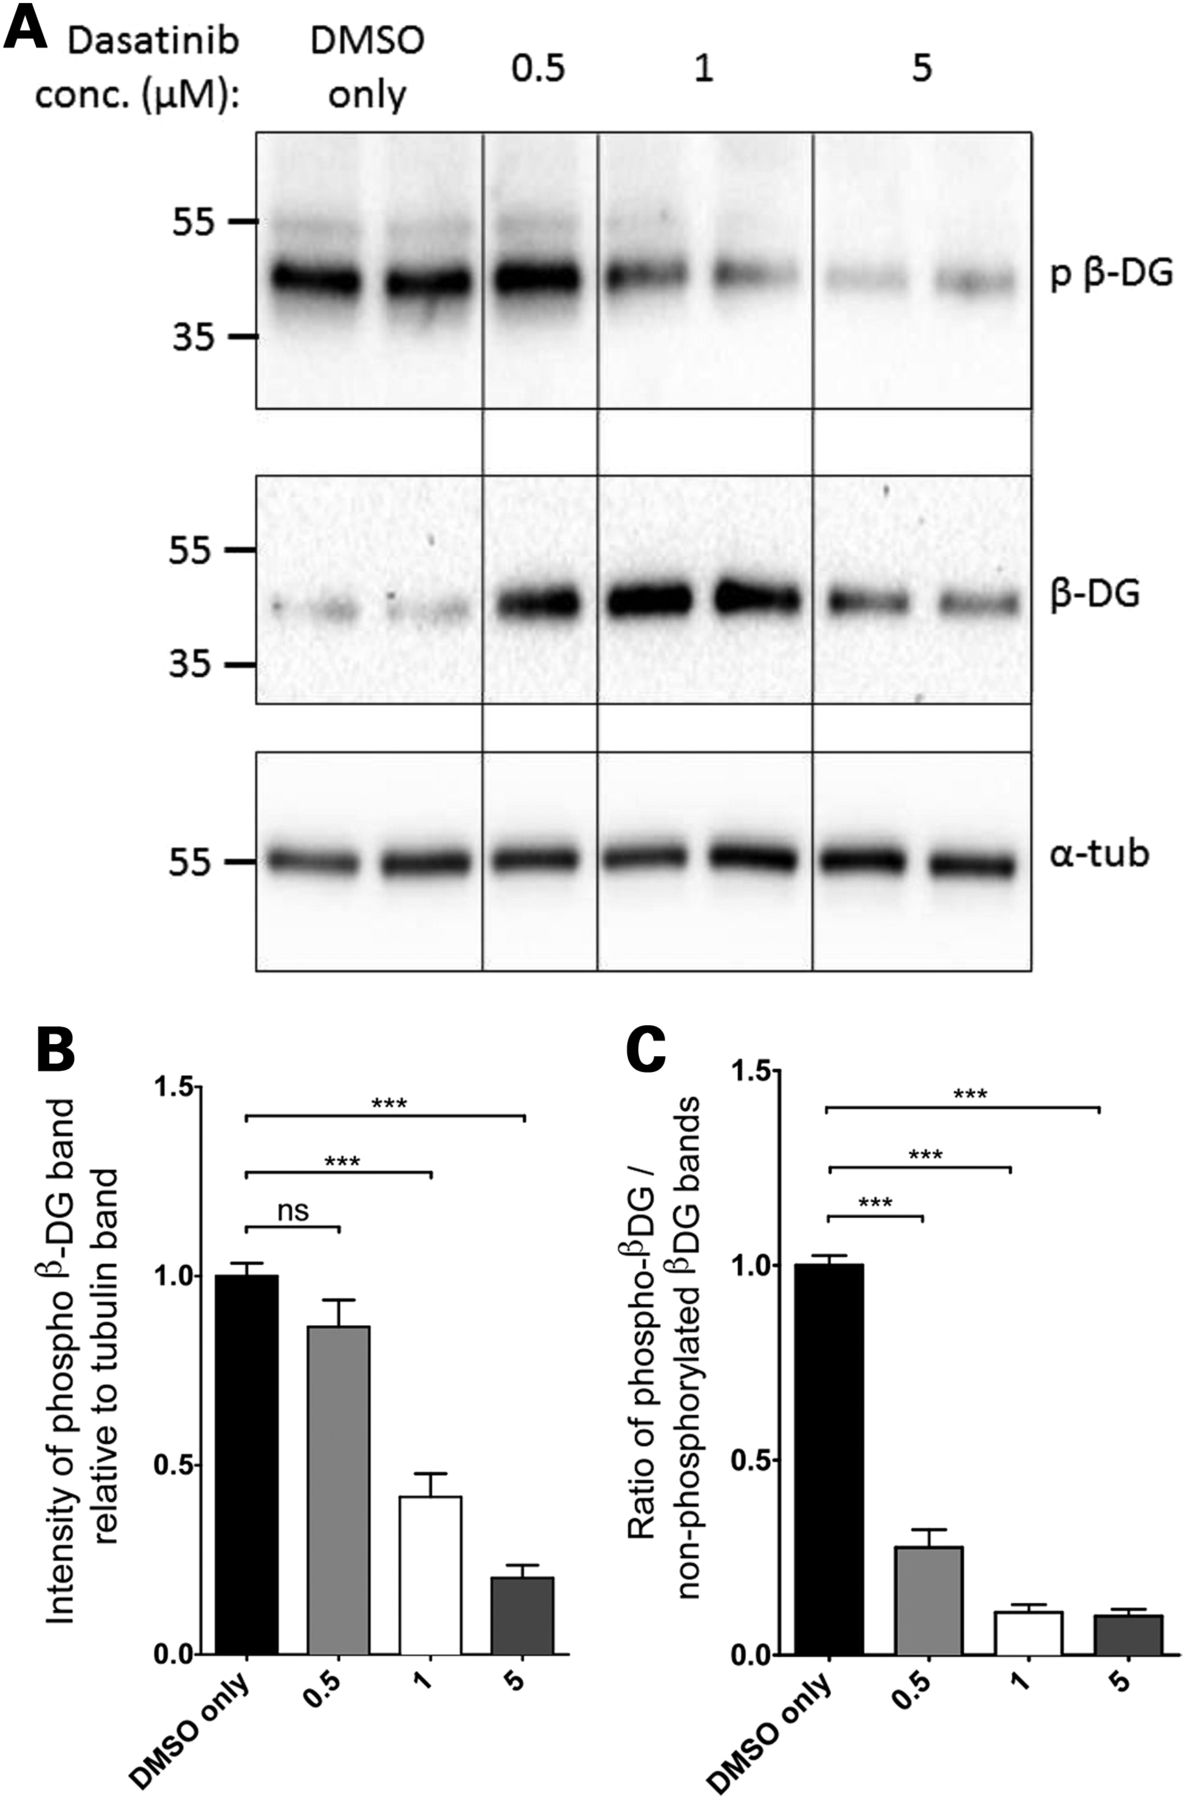
Fig. 4 Phosphorylated β-dystroglycan in dasatinib-treated wild-type zebrafish larvae. Pools of 10 LWT zebrafish embryos were treated with dasatinib or DMSO from 24 hpf until 96 hpf and then lysed for SDS–PAGE. (A) A western blot of lysates probed with antibodies against phosphorylated β-dystroglycan (top panel), β-dystroglycan (middle panel) and α-tubulin (bottom panel). Numbers represent relative position of molecular weight markers in kDa. (B) The density of the blot probed against phosphorylated dystroglycan was quantified relative to α-tubulin levels in each sample, and represented as a ratio to the average DMSO only control signal. There is a significant decrease in the level of phosphorylated β-dystroglycan in dasatinib-treated embryos, compared with DMSO-treated controls. (C) The density of the blot probed against phosphorylated dystroglycan was quantified relative to non-phosphorylated dystroglycan levels in each sample, and normalized to the average DMSO only control signal. There is a significant decrease in the ratio of phosphorylated to non-phosphorylated dystroglycan in dasatinib-treated embryos, compared with DMSO-treated controls. Graphs show mean + SEM of at least eight samples for each treatment, from three independent experiments. One-way analysis of variance (ANOVA) was carried out followed by Dunnett′s multiple comparison test (ns, non-significant; ***P < 0.001).
Image
Figure Caption
Figure Data
Acknowledgments
This image is the copyrighted work of the attributed author or publisher, and
ZFIN has permission only to display this image to its users.
Additional permissions should be obtained from the applicable author or publisher of the image.
Full text @ Hum. Mol. Genet.

