
|
Fig. S1
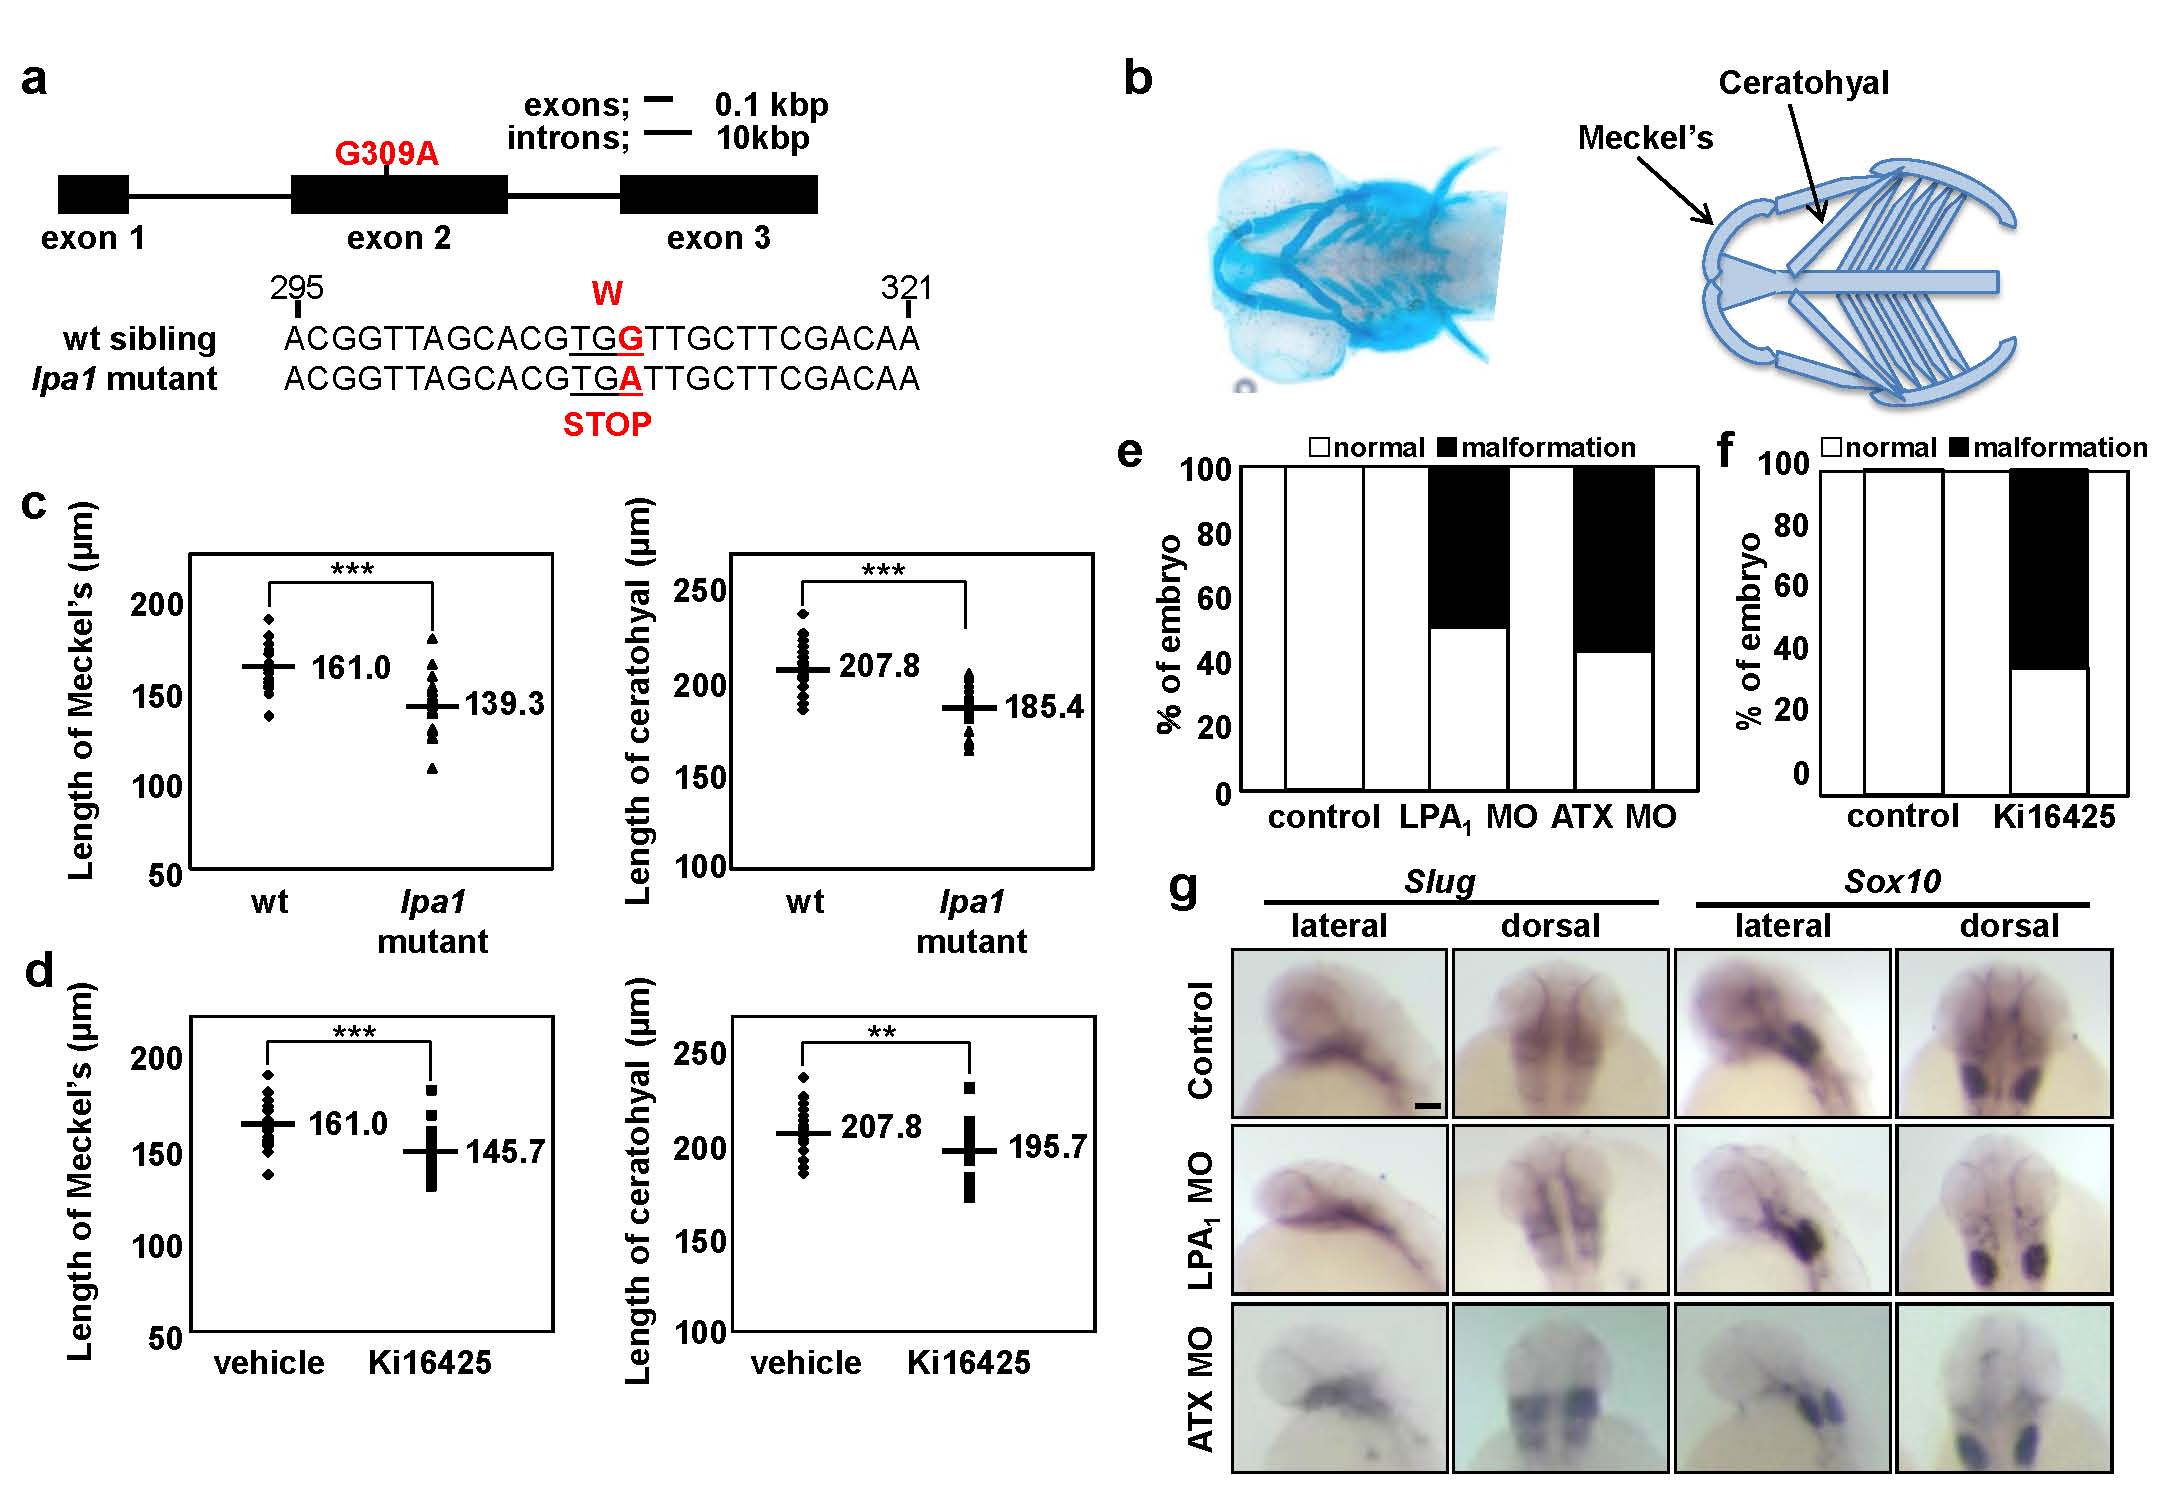
Loss of ATX-LPA1 signaling resulted in dyschondroplasia in zebrafish.
(a) DNA sequence of wt and lpa1 mutant zebrafish induced by tilling assay. The gene structure of zebrafish lpa1 from exon1 –3 is also shown. (b) Cartilages of zebrafish embryo around 96 hpf visualized by alcian blue and alizarin red staining (dorsal view). Schematic diagram is also shown. (c,d) Loss of LPA1 signaling leads to deformation of gill cartilages. Length of Meckel’s and ceratohyal cartilages in wt and lpa1 mutant zebrafish (c) and in vehicle-or Ki16425-treated wt zebrafish (d) (Data are mean ± s.d., n = 20-22, **P<0.01, ***P<0.001). (e, f) Loss of ATX-LPA1 signaling leads to deformation of cephalic region. Percentage of LPA1 or ATX morphant embryos (e) and Ki16425-treated wt zebrafish embryos (f) with obvious cephalic malformation (Fig. 1b) is shown. (g) The expression patterns of slug and sox10, markers of CNCCs, in wt, LPA1 or ATX morphant embryos. Scale bar: 50 µm.